Nutrition 13 min read
Fatty Liver and Sugar Intake: What You Need to Know
You feel fine. Your blood work last year was unremarkable. You are not overweight. Yet inside your liver, fat is quietly accumulating, driven not by alcohol, not by…
Reading about body composition? Find an InBody test centre near you →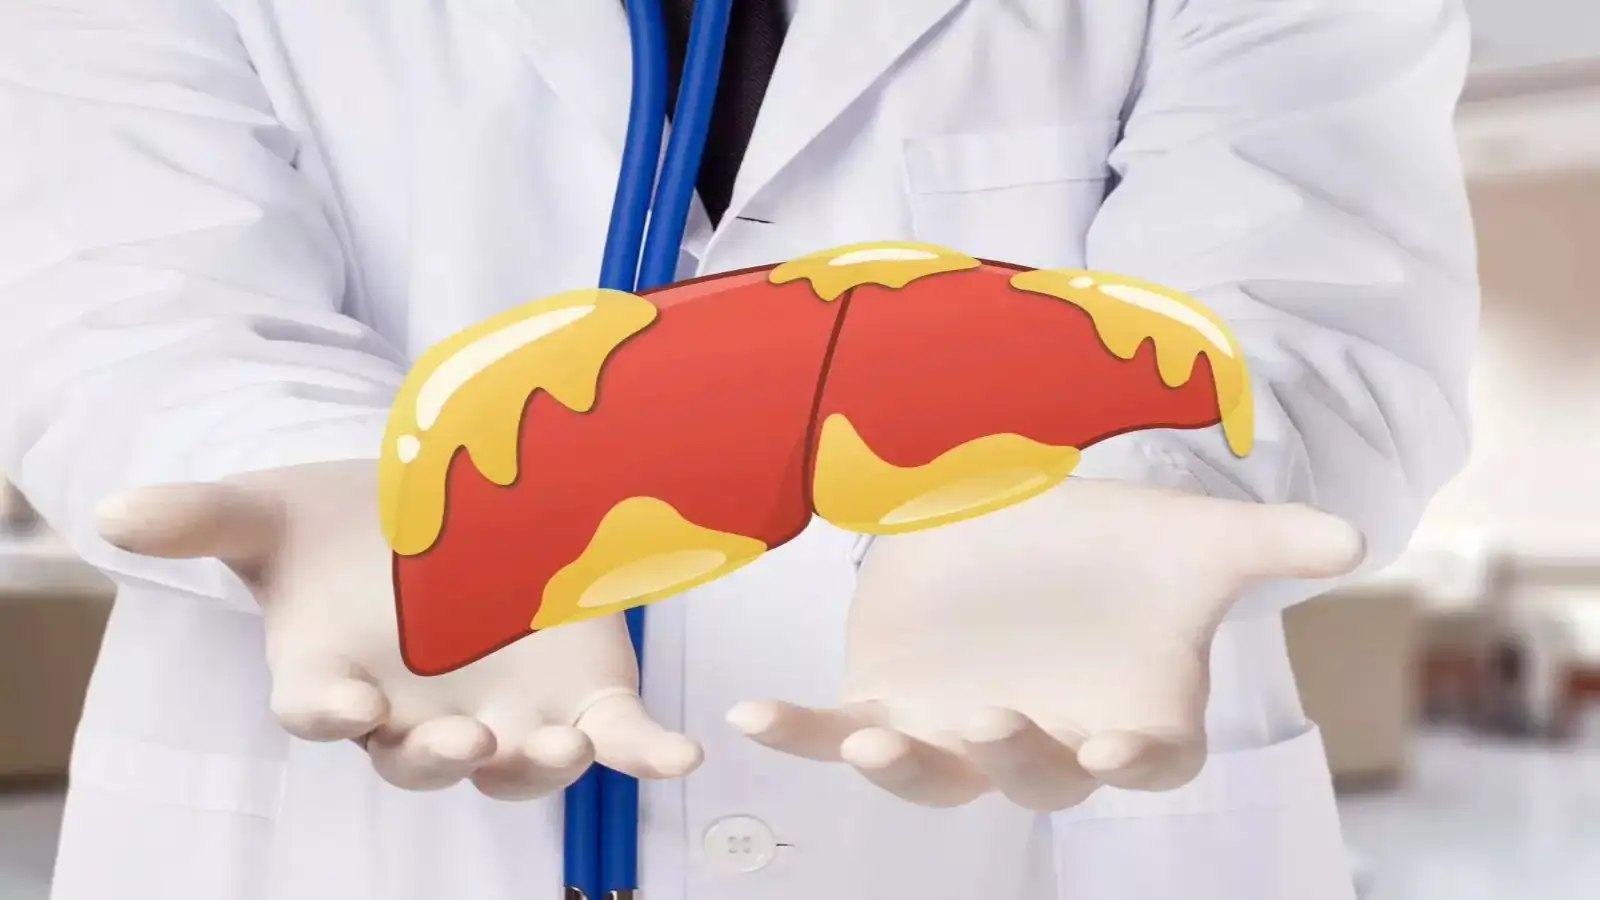
You feel fine. Your blood work last year was unremarkable. You are not overweight. Yet inside your liver, fat is quietly accumulating, driven not by alcohol, not by genetics alone, but by the sugar you consume every day. This is non-alcoholic fatty liver disease (NAFLD). And the connection between fatty liver and sugar intake is one of the most clinically important, and most underappreciated, relationships in metabolic medicine.
Sugar, the liver, and a silent epidemic
NAFLD affects approximately 25% of the global adult population, making it the most common liver disorder worldwide. In India, prevalence estimates range from 9% to 32%, depending on the population studied and are rising fast, driven by urbanisation, processed food consumption, and sedentary lifestyles.
Most patients have no symptoms. No jaundice. No pain. No warning. The liver silently fills with fat over months and years, progressing from simple steatosis to inflammation (NASH), fibrosis, and ultimately cirrhosis or liver cancer in a significant proportion of cases. Understanding the role of dietary sugar in this process is the first and most actionable step toward prevention and reversal.
| 25% Estimated global adult prevalence of NAFLD | 2–3× Increased NAFLD risk with high added sugar intake vs low | 9–32% NAFLD prevalence range in Indian adults | 8–10 weeks Time for measurable liver fat reduction after eliminating sugar-sweetened beverages |
The Indian context: the “thin-fat” risk factor. Indian populations carry a well-documented genetic predisposition to accumulating visceral fat and developing insulin resistance at lower BMI values compared to Western populations. This means NAFLD risk is often present in individuals who do not appear overweight by conventional measures, and standard BMI cutoffs significantly underestimate metabolic liver risk in Indian patients.
What is non-alcoholic fatty liver disease?
Fatty liver disease occurs when fat constitutes more than 5–10% of the liver’s total weight in the absence of significant alcohol consumption. It exists on a progressive spectrum:
- Stage 1 Simple steatosis (early NAFLD): Fat accumulates in liver cells (hepatocytes) with no significant inflammation. Reversible with dietary intervention.
- Stage 2 Non-alcoholic steatohepatitis (NASH): Inflammation and liver cell injury develop alongside fat accumulation. Risk of fibrosis.
- Stage 3–4 Fibrosis and cirrhosis: Progressive liver scarring that can lead to liver failure or hepatocellular carcinoma. Difficult to reverse.
The critical distinction from alcoholic liver disease is that NAFLD occurs in individuals who drink little or no alcohol. Diet, particularly excess sugar, is the primary modifiable driver. And unlike genetics or age, diet can be changed.
How does sugar intake damage the liver?
Not all sugars affect the liver equally. The critical distinction lies between glucose and fructose, the two components of table sugar (sucrose) and high-fructose corn syrup.
Glucose versus fructose: a critical difference
Glucose is metabolised throughout the entire body by muscles, the brain, red blood cells, and other organs. The liver processes only a fraction of ingested glucose under normal conditions.
Fructose, however, is almost exclusively metabolised by the liver. When large quantities arrive simultaneously, as they do when you drink a 500 ml can of soda, the liver converts the excess directly into fat through a process called de novo lipogenesis (DNL). This is the central biochemical mechanism linking fatty liver and sugar intake.
The de novo lipogenesis pathway: step by step
- Fructose is rapidly absorbed from the small intestine and transported directly to the liver via the portal vein.
- Unlike glucose, fructose bypasses the key regulatory enzyme phosphofructokinase-1 (PFK-1), meaning it is metabolised in an unregulated manner regardless of the body’s energy needs.
- Excess fructose is converted into acetyl-CoA, which feeds into de novo lipogenesis. The liver manufactures new fat molecules (triglycerides).
- These triglycerides are either stored within hepatocytes (causing steatosis) or exported as VLDL particles, raising blood triglyceride levels.
- Repeated overload triggers inflammation, oxidative stress, and hepatocyte injury, driving progression toward NASH.
The role of insulin resistance
Chronic high sugar intake drives insulin resistance, a condition where cells no longer respond effectively to insulin signals. This creates a reinforcing cycle in the liver:
- High insulin levels stimulate further fat production in the liver (lipogenesis)
- Insulin resistance impairs the liver’s ability to export triglycerides, causing fat to accumulate further
- Elevated free fatty acids from adipose tissue flood the liver, adding to the fat load
- Resulting oxidative stress and chronic inflammation accelerate NAFLD progression toward NASH and fibrosis
Key Clinical Insight:
“A normal BMI does not rule out significant hepatic fat accumulation. For Indian patients, particularly, visceral fat can be elevated even at a normal weight, making body composition analysis the only reliable way to detect subclinical NAFLD risk that the scale cannot see.”
Hidden sugar sources that harm your liver
Most people associate sugar with sweets and soft drinks. But the biggest threat often comes from less obvious sources. When assessing a patient’s fatty liver and sugar intake burden, screen carefully for these hidden sources:
| Food / Drink | Hidden Sugar (approx.) | Liver Risk |
|---|---|---|
| Fruit juice (250 ml) | 24 g (6 tsp) | High |
| Flavoured yoghurt (200 g) | 16–22 g | High |
| Sports drink (500 ml) | 30–34 g | High |
| Sweetened coffee drink | 20–45 g | High |
| ‘Healthy’ granola bar | 12–18 g | Moderate |
| Pasta sauce (½ cup) | 8–12 g | Moderate |
| Low-fat salad dressing (2 tbsp) | 5–8 g | Low–Moderate |
| Bread (2 slices, white) | 3–5 g | Low |
Fruit juice deserves special attention. Despite being perceived as healthy, 250 ml of apple or orange juice delivers as much fructose as a soft drink without the fibre of whole fruit that would slow its absorption. For patients with NAFLD, fruit juice is a sugar-sweetened beverage and should be treated as one.
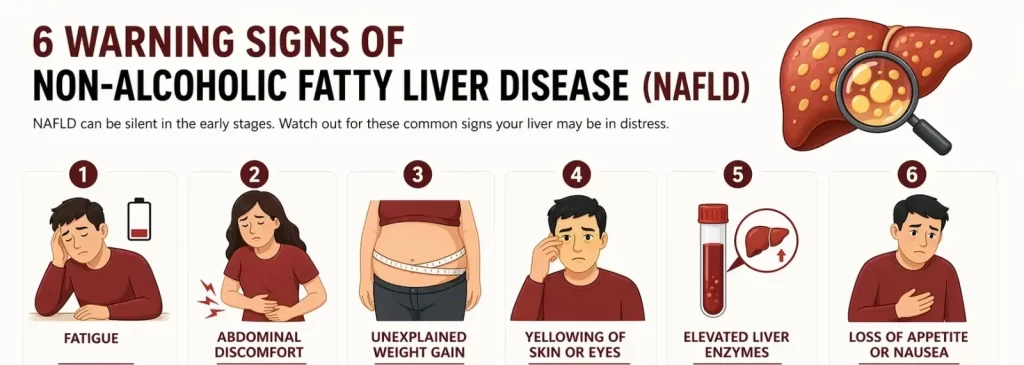
Warning signs of fatty liver disease
Early-stage NAFLD is typically silent. This is precisely why routine screening in individuals with metabolic risk factors is critical. When symptoms do appear, they may include:
- Persistent fatigue and generalised weakness often the first reported symptom
- Dull discomfort or fullness in the upper right abdomen
- Unintentional weight gain, particularly around the midsection
- Elevated liver enzymes (ALT, AST) on routine blood tests often the only early signal
- High fasting triglycerides or low HDL cholesterol
- Acanthosis nigricans dark patches on the neck or armpits, a visible marker of insulin resistance.
How much sugar is too much for liver health?
Global health authorities are clear on daily added sugar limits:
- WHO: Less than 10% of total daily energy from free sugars (roughly 50 g for a 2,000 kcal diet), with an additional benefit target of less than 5%
- American Heart Association: No more than 25 g per day for women and 36 g per day for men
- For existing NAFLD patients: Many hepatologists advise less than 20 g of added sugar per day
To put this in context: A single 355 ml can of regular cola contains approximately 39 g of sugar, already exceeding the entire daily recommended limit in one beverage. A large sweetened coffee from a café can contain 50–60 g. A bottle of commercial fruit juice: 50+ g. The gap between what people consume and what their livers can safely process is vast.
What InBody reveals that standard tests miss
For clinicians managing patients with suspected NAFLD or metabolic liver risk, InBody body composition analysis provides objective data that blood tests and BMI simply cannot deliver. The four InBody parameters most critical in fatty liver risk assessment:
- Visceral Fat Level measures dangerous organ fat. Directly elevated visceral adipose tissue (VAT) is the strongest body composition predictor of NAFLD severity, independent of total body weight or BMI.
- Body Fat Percentage & Mass quantifies the hidden fat burden invisible to the scale, particularly relevant in the “thin-fat Indian” phenotype where NAFLD risk exists at normal weight.
- Skeletal Muscle Mass (SMM) confirms that sarcopenia co-exists with low muscle mass, worsens insulin resistance, and accelerates NAFLD progression, and is invisible on a weighing scale.
- Phase Angle reflects cellular integrity and metabolic resilience typically low in patients with metabolic liver disease, and is a meaningful marker of intervention response.
Why this matters clinically: A reduction in visceral fat area of 10–20 cm² measurable via serial InBody scans corresponds to clinically meaningful improvements in liver enzyme levels, insulin sensitivity, and intrahepatic fat content. Body composition monitoring turns dietary intervention from a matter of faith into a matter of measurable data.
Evidence-based dietary strategies to reduce liver fat
Early-stage fatty liver disease can be reversed. Dietary modification is the most effective, safest, and most accessible first-line intervention. The following strategies are supported by clinical evidence and directly address the fatty liver and sugar intake relationship.
- Eliminate sugar-sweetened beverages first. SSBs sodas, fruit juices, energy drinks, and sweetened teas are the single largest source of dietary fructose. Eliminating them alone can produce measurable reductions in liver fat within 8–10 weeks. This is the highest-yield, lowest-cost intervention available.
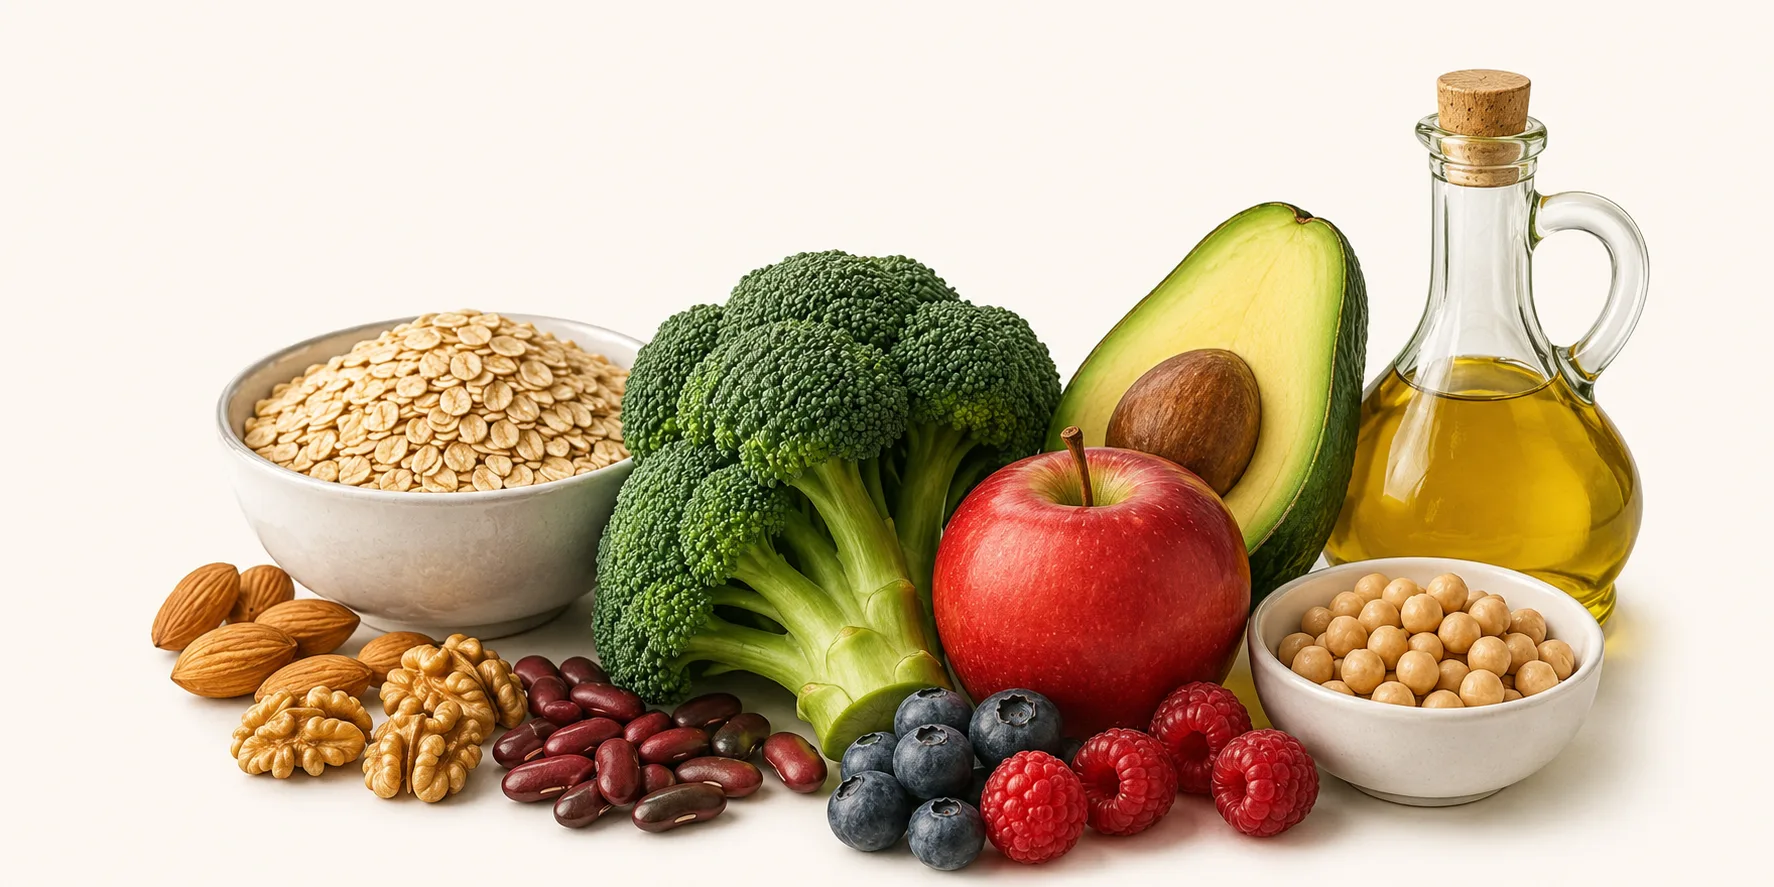
- Adopt a low-sugar Mediterranean-style diet. Multiple RCTs show that a Mediterranean diet rich in vegetables, legumes, olive oil, oily fish, and whole grains, low in refined carbohydrates and added sugars, reduces liver fat independently of weight loss. Increasing omega-3 fatty acids (salmon, sardines, walnuts, flaxseed) is particularly beneficial.
- Target 7–10% body weight reduction, guided by body composition data. Studies show that 5% weight loss reduces liver steatosis; 7–10% can resolve NASH in a significant proportion of patients; greater than 10% has been associated with fibrosis regression. The key is ensuring that the weight lost is predominantly fat mass, particularly visceral fat, which InBody serial scans can confirm.
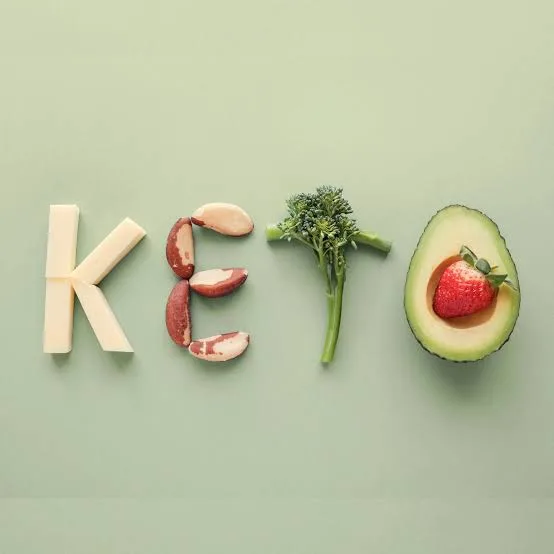
- Reduce total refined carbohydrate load. Very low-carbohydrate and ketogenic dietary approaches have shown rapid reductions in intrahepatic lipid content, sometimes within 2 weeks. These should be supervised by a qualified dietitian, particularly in patients on medications for diabetes or hypertension.
- Combine resistance training with dietary change. Unlike cardio alone, resistance training builds skeletal muscle mass, which improves insulin sensitivity and reduces hepatic fat accumulation. For NAFLD patients, particularly those with low muscle mass, resistance training is not optional. It is a core component of the intervention.
A clinical protocol for NAFLD management with InBody
The following evidence-informed protocol is recommended for clinicians managing patients with NAFLD or metabolic liver risk:
- Baseline InBody scan before any intervention. Establish absolute values for visceral fat level, body fat %, body fat mass, skeletal muscle mass, and phase angle. This creates a measurable baseline independent of body weight or BMI, and reveals true metabolic risk in normal-weight patients.
- Dietary audit focused on sugar and fructose sources. Use the hidden sugar table above as a screening tool. Calculate the estimated daily fructose load. Identify the two or three highest-yield substitutions typically SSBs, flavoured yoghurts, and fruit juice and eliminate these first.
- Prescribe resistance training alongside dietary change. Minimum 3 sessions per week targeting major muscle groups with progressive overload. This directly improves insulin sensitivity, supports visceral fat reduction, and preserves or builds the skeletal muscle mass that is critical for long-term metabolic health.
- Optimise protein intake using InBody fat-free mass data. Target 1.4–2.0 g/kg of ideal body weight per day, distributed across 3–4 meals. InBody fat-free mass data enables precise protein prescriptions rather than relying on total body weight, which overestimates protein needs in patients with high body fat.
- Monitor body composition, not body weight, every 4–6 weeks. Counsel patients that the scale will not accurately reflect changes during body recomposition. InBody data showing visceral fat declining and muscle mass rising is the true progress measure, and the most powerful motivational tool available.
- 12-week outcome review: compare InBody reports. Expected positive outcomes at 12 weeks: visceral fat reduction of 1–3 levels, body fat mass reduction of 1–3 kg, and phase angle improvement. If liver enzymes remain elevated or InBody data shows inadequate visceral fat reduction, review dietary compliance, sleep quality, and stress, all of which directly affect hepatic fat metabolism.

- NAFLD represents one of the most underserved patient populations in Indian healthcare. These individuals are often not diabetic, not obese by conventional metrics, and not considered “at risk”, so they fall through the clinical net. Yet they carry real metabolic risk and respond strongly to targeted intervention once given objective data.
- For Diabetes & Metabolic Clinics: NAFLD patients are pre-diabetic risk cases hiding in a normal-weight population. InBody allows you to identify elevated visceral fat early, intervene with precise dietary and exercise protocols, and document outcomes objectively, preventing progression to overt type 2 diabetes and advanced liver disease.
- For Gastroenterology & Hepatology Clinics: Serial InBody scans provide an objective, non-invasive method to monitor NAFLD intervention response between imaging appointments, showing visceral fat trends and phase angle changes that correlate with improving liver health.
- For Dietitians & Nutrition Practitioners: Protein prescriptions based on total body weight are inaccurate for patients with elevated body fat. InBody fat-free mass data enables precise, personalised targets, and serial scans confirm whether those targets are supporting muscle retention during weight loss.
Frequently asked questions
Q. Can cutting sugar reverse fatty liver disease?
Yes, in early-stage NAFLD (simple steatosis), reducing added sugar intake and achieving modest weight loss through dietary change can fully reverse liver fat accumulation. Studies using MRI spectroscopy show measurable reductions in liver fat within 8–10 weeks of eliminating sugar-sweetened beverages alone. Even in more advanced stages (NASH), dietary modification significantly slows progression and can improve liver enzyme levels.
Q. Is fruit juice bad for the liver?
Fruit juice, including 100% natural juice, behaves like a sugar-sweetened beverage when it comes to liver health. The fibre in whole fruit slows fructose absorption and blunts the liver’s lipogenic response. Juice lacks this fibre, delivering a rapid fructose load directly to the liver. For patients with NAFLD or elevated visceral fat, fruit juice should be eliminated and replaced with whole fruit consumed in moderate portions.
Q. How does InBody help detect NAFLD risk?
InBody body composition analysers measure visceral fat level, body fat percentage, skeletal muscle mass, and phase angle independently of body weight or BMI. A patient with a normal BMI can show on an InBody scan that their visceral fat is elevated, their muscle mass is low, and their phase angle is reduced, the classic metabolic risk profile strongly associated with NAFLD. Serial scans every 4–6 weeks, then objectively track whether dietary and exercise interventions are producing real changes in liver-relevant body composition markers.
Q. Is NAFLD more common in India?
NAFLD is rapidly increasing in India, with prevalence estimates ranging from 9% to 32% depending on the population. Indians carry a well-documented genetic predisposition to accumulating visceral fat and developing insulin resistance at lower BMI values compared to Western populations, the “thin-fat Indian” phenotype described by Yajnik and Yudkin. This means NAFLD risk is present at lower body weights in Indian patients, and standard Western BMI cutoffs substantially underestimate the need for early screening and dietary intervention.
Q. What is the connection between fatty liver and diabetes?
NAFLD and type 2 diabetes share a common root: Insulin resistance. NAFLD is present in up to 70% of type 2 diabetic patients and is itself an independent risk factor for developing diabetes. Excess hepatic fat directly impairs the liver’s response to insulin, worsening systemic glucose regulation. Addressing fatty liver and sugar intake in pre-diabetic patients is therefore a direct intervention against diabetes progression, not just liver disease management.
Conclusion: The liver cannot wait for symptoms to appear
Fatty liver disease is defined by what you cannot feel and cannot measure on a scale. It builds silently over the years, fed by daily fructose loads from beverages, snacks, and hidden dietary sources long before any symptom, any pain, or any blood test result prompts concern.
Reducing sugar intake, starting with sugar-sweetened beverages, is the highest-yield, most accessible intervention available. Combined with resistance training, adequate protein, and modest visceral fat reduction, early-stage NAFLD is genuinely reversible. But only if it is detected before it progresses, and only if the intervention is monitored with tools that can measure what actually matters.
That is what InBody delivers: Not a weight on a scale, but a complete metabolic picture, visceral fat level, skeletal muscle mass, and phase angle that guides every clinical decision and makes the invisible visible before it becomes irreversible.
Ready to screen for NAFLD risk in your clinic?
InBody body composition analysers give clinicians the data to detect elevated visceral fat in normal-weight patients, track the metabolic impact of dietary sugar reduction, and document real improvements in liver-relevant body composition markers beyond what any blood test or weighing scale can tell you.

Find an InBody Scanner Near You
Medical Disclaimer: This blog is intended for healthcare professionals and is for informational and educational purposes only. It does not constitute medical advice, diagnosis, or treatment recommendations. Clinical decisions regarding patient management should be made by qualified healthcare providers based on individual patient assessment. InBody results should be interpreted in conjunction with a full clinical evaluation.
References & further reading
- Chalasani N, et al. — The Diagnosis and Management of Non-Alcoholic Fatty Liver Disease. Hepatology, 2012
- Stanhope KL — Sugar Consumption, Metabolic Disease and Obesity: The State of the Controversy. Critical Reviews in Clinical Laboratory Sciences, 2016
- Yajnik CS, Yudkin JS — The Y-Y Paradox: The Thin-Fat Indian. Lancet, 2004
- Loomba R, Sanyal AJ — The Global NAFLD Epidemic. Nature Reviews Gastroenterology & Hepatology, 2013
- Romero-Gómez M, et al. — Treatment of NAFLD With Diet, Physical Activity and Exercise. Journal of Hepatology, 2017

Most trending articles
Keto Diet in India: What Happens to Your Body Composition (The Real Data, Not the Hype)
Keto is India's most-googled diet. But what does body composition testing show after 8 weeks on keto? Rapid fat loss or dangerous muscle loss? The India-specific guide to keto with body composition tracking.

Protein Powder in India 2026: What Works, What’s Fake, and How Much You Actually Need
India's protein supplement market is flooded with adulterated products. Which proteins work for Indian body goals, what lab tests reveal, and how body composition tracking shows if your protein is building muscle.

India’s Sugar Problem: How Chai, Mithai, and Hidden Sugar Are Destroying Your Visceral Fat Numbers
The average Indian consumes 19 teaspoons of sugar daily — 3x the WHO recommendation. How added sugar drives visceral fat storage specifically, and the 8-week body composition transformation when you cut it.