Body Composition 10 min read
BMI vs Body Composition: The Truth About Fitness BMI Misses
Fitness is not a number on a scale. Yet most of us still judge our health by weight alone. In fact, BMI, the most widely used fitness metric…
Reading about body composition? Find an InBody test centre near you →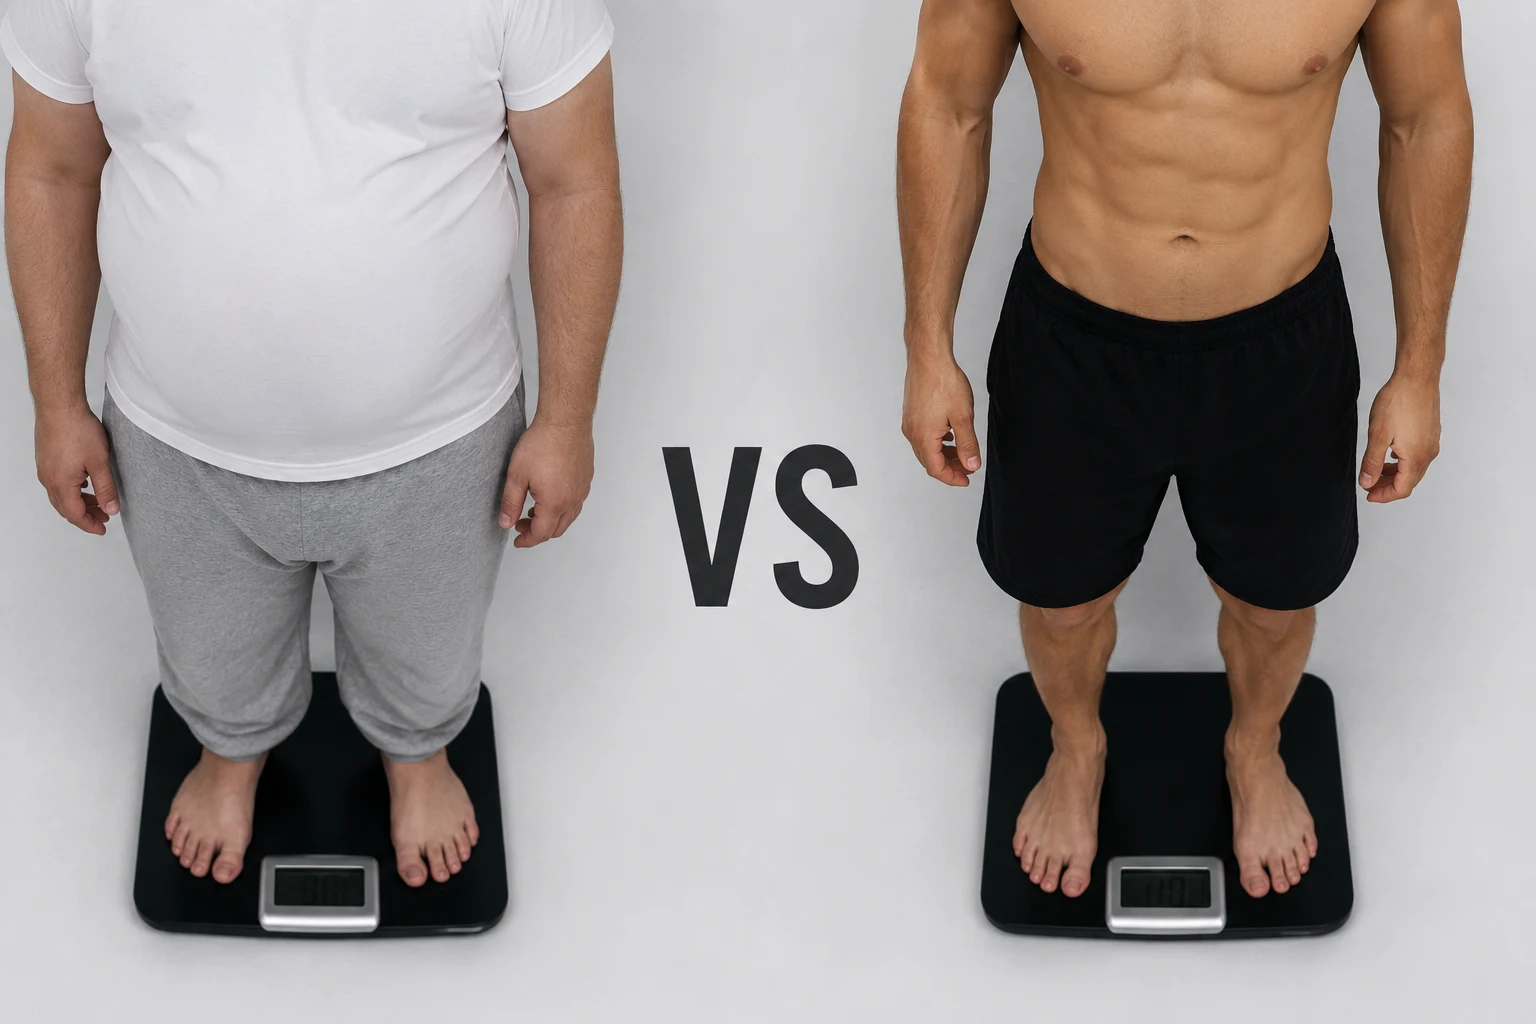
Fitness is not a number on a scale. Yet most of us still judge our health by weight alone. In fact, BMI, the most widely used fitness metric in the world, was never designed to measure fitness at all. Furthermore, it cannot distinguish fat from muscle, and it has no way to detect the dangerous visceral fat that builds up around your organs. As a result, millions of people who appear “healthy” by BMI standards are, in reality, carrying serious metabolic risk.
Consequently, the question is not how much you weigh. The real question is: what is your body actually made of? In this article, we break down the 5 body composition metrics that tell the truth about your fitness and explain why InBody’s body composition analysis is the only tool that measures all of them accurately.
| 98.4% InBody accuracy vs DEXA gold standard | 60 sec Time for a complete InBody scan | 5 Key metrics BMI completely misses | 101M Indians living with Type 2 diabetes |
What Is BMI And Why Does It Fall Short?
BMI, or Body Mass Index, is calculated using just two numbers: your weight and your height. It was originally developed in the 1830s as a statistical tool for studying populations not individuals. Moreover, it was never intended to assess body fat, muscle health, or metabolic risk in a clinical setting.
Despite this, BMI became the global default for health screening. However, the problems are significant. BMI cannot tell the difference between fat and muscle. A fit athlete with high muscle mass will often register as “overweight” or even “obese” by BMI. Meanwhile, a sedentary person with low muscle and high hidden fat can score in the “healthy” range and go completely undetected.
WHY THIS MATTERS ESPECIALLY FOR INDIANS
Research shows that South Asian patients develop metabolic disease at BMI levels that Western guidelines classify as healthy. The “thin-fat Indian” phenotype low body weight but high visceral fat, is widespread across India. As a result, using BMI alone leads to systematic under-detection of real metabolic risk. Learn more about the thin-fat Indian phenomenon.
The 5 Body Composition Metrics That Actually Measure Fitness
Instead of relying on BMI, body composition analysis gives you a full, detailed picture of what your body is made of. Specifically, InBody measures five key markers that BMI completely ignores. Each one tells a different, critical part of your fitness story.
1. Body Fat Percentage Not Just How Much Fat, But How Much Is Too Much
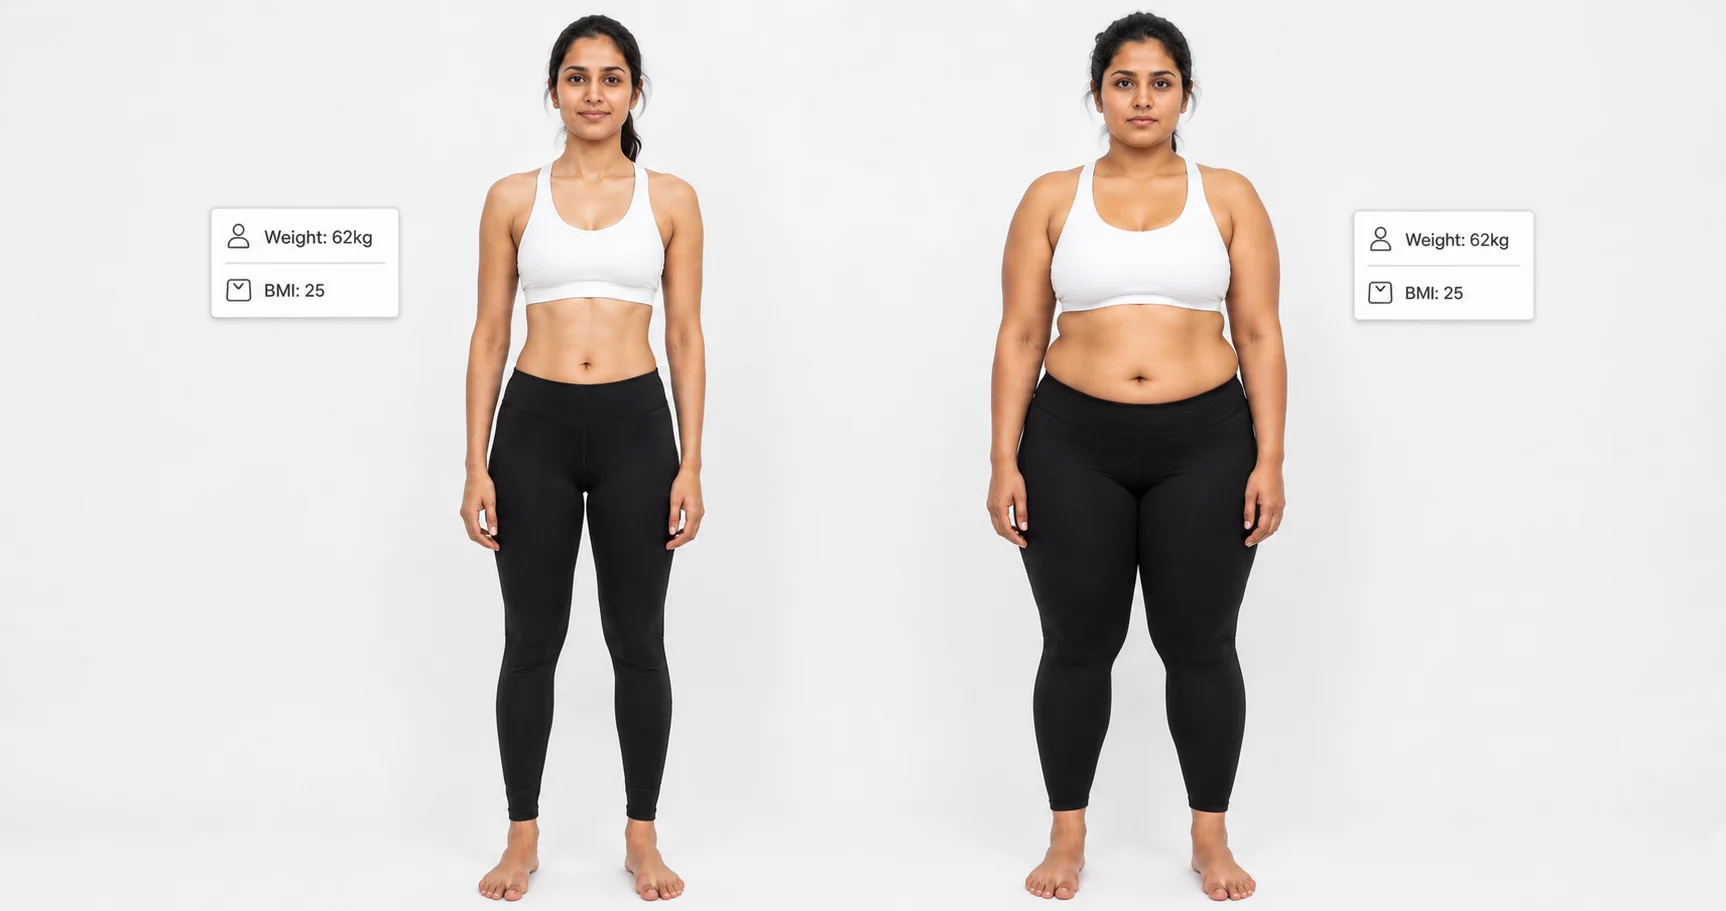
Body fat percentage tells you what proportion of your total body weight is fat tissue. This is fundamentally different from BMI, which only uses weight and height. For example, two people can have identical BMIs of 24 but very different body fat levels one at 18% (athletic) and one at 34% (obese by composition).
Furthermore, the healthy range for body fat percentage differs between men and women, and between Indian and Western populations. InBody applies population-specific reference ranges, which are especially important for Indian patients.
2. Skeletal Muscle Mass: The Most Underrated Fitness Metric
Skeletal muscle mass is the total amount of lean muscle in your body. It is arguably the most important and most overlooked fitness metric. In addition to making you stronger, muscle mass directly controls how well your body processes glucose. In fact, skeletal muscle is responsible for approximately 80% of insulin-stimulated glucose uptake. This means low muscle mass is an independent risk factor for Type 2 diabetes regardless of your body fat level.
Moreover, India faces a serious hidden crisis of low skeletal muscle mass. Driven by protein-deficient diets, sedentary lifestyles, and low awareness of strength training, sarcopenia, the clinical term for dangerously low muscle mass, is prevalent across all age groups in India, not just the elderly.
KEY INSIGHT
BMI goes up when you gain muscle and goes down when you lose it, making it actively misleading for anyone doing resistance training. InBody measures skeletal muscle mass directly, so you know exactly whether changes in your body are coming from fat loss, muscle gain, or both.
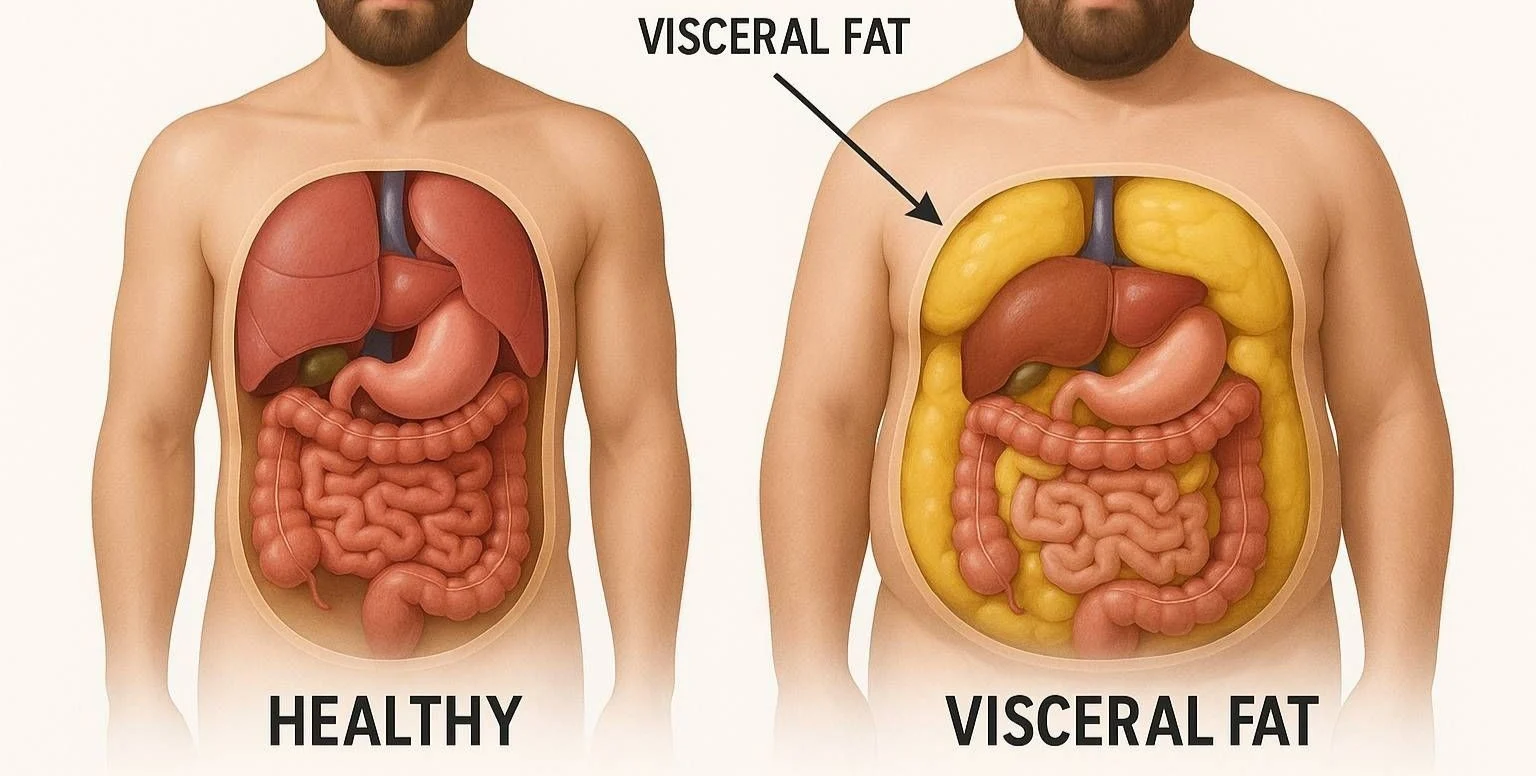
3. Visceral Fat Level: The Hidden Danger BMI Cannot See
Visceral fat is the fat that surrounds your internal organs your liver, pancreas, and intestines. Unlike subcutaneous fat (the fat you can pinch under your skin), visceral fat is metabolically active and directly drives insulin resistance, inflammation, and cardiovascular disease. Consequently, a high visceral fat level is one of the strongest predictors of Type 2 diabetes, fatty liver disease, and heart disease.
BMI has absolutely no way to measure visceral fat. Furthermore, research consistently shows that Indians develop dangerously high visceral fat levels at BMI values that Western guidelines classify as healthy. Specifically, a visceral fat level of 10 or above at a BMI of 24 is a common finding in Indian patients and it is only detectable through body composition analysis.
4. Segmental Lean Analysis: Where Your Muscle Actually Is
Segmental lean analysis breaks your muscle mass down by body segment: right arm, left arm, trunk, right leg, and left leg. This level of detail matters for several reasons. First, it identifies left-right muscle imbalances that predict injury risk, especially relevant for Indian cricketers, tennis players, and runners. Second, it reveals leg muscle deficits, which are particularly important because the legs are the primary site of glucose disposal in the body.
In addition, segmental lean analysis allows personal trainers, physiotherapists, and sports medicine doctors to design truly targeted exercise programmes rather than generic plans based only on total weight.
5. ECW/TBW Ratio: Your Body’s Hidden Inflammation Marker
The ECW/TBW ratio, extracellular water to total body water, is a marker of cellular health and systemic inflammation. A normal ratio is below 0.380. However, a ratio of 0.390 or above indicates chronic low-grade inflammation, nutritional deficiency, or disease progression. Notably, this marker is elevated in patients with metabolic syndrome, post-surgical states, and conditions of malnutrition, all of which are common in India.
Because of this, the ECW/TBW ratio is one of the most clinically significant markers InBody measures. Nevertheless, it is completely invisible to BMI, standard blood tests, or a weighing scale.
BMI vs Body Composition Analysis: A Direct Comparison
| What You Want to Know | BMI | InBody Body Composition |
|---|---|---|
| Am I carrying too much fat? | Partial weight only, no fat detail | Yes, precise body fat % with Indian-specific ranges |
| Do I have enough muscle? | No, cannot measure muscle at all | Yes, skeletal muscle mass in kg vs population norm |
| Is my visceral fat dangerous? | No, completely invisible to BMI | Yes, Visceral Fat Level on a 1–20 scale |
| Are my muscles balanced left to right? | No | Yes, segmental lean analysis per limb |
| Am I inflamed or nutritionally depleted? | No | Yes, ECW/TBW ratio |
| Is my body improving with exercise? | Unreliable muscle gain raises BMI | Yes, tracks fat loss and muscle gain independently |
| Is my result specific to my ethnicity? | No, uses Western population norms | Yes, Asian-specific reference values applied |
What Happens When You Get an InBody Scan?
Getting a body composition scan with InBody is quick, non-invasive, and completely safe. Here is exactly what the process looks like from start to finish.
- Remove shoes and socks. Stand barefoot on the InBody device. The scan requires direct electrode contact with the soles of your feet.
- Hold the hand electrodes. Grip the hand-held electrodes firmly with both hands. The device now has contact points at all four limbs plus the trunk.
- Stay still for 60 seconds. A safe, low-level electrical current passes through your body. You feel nothing. The device measures impedance resistance to the current at six different frequencies through each body segment.
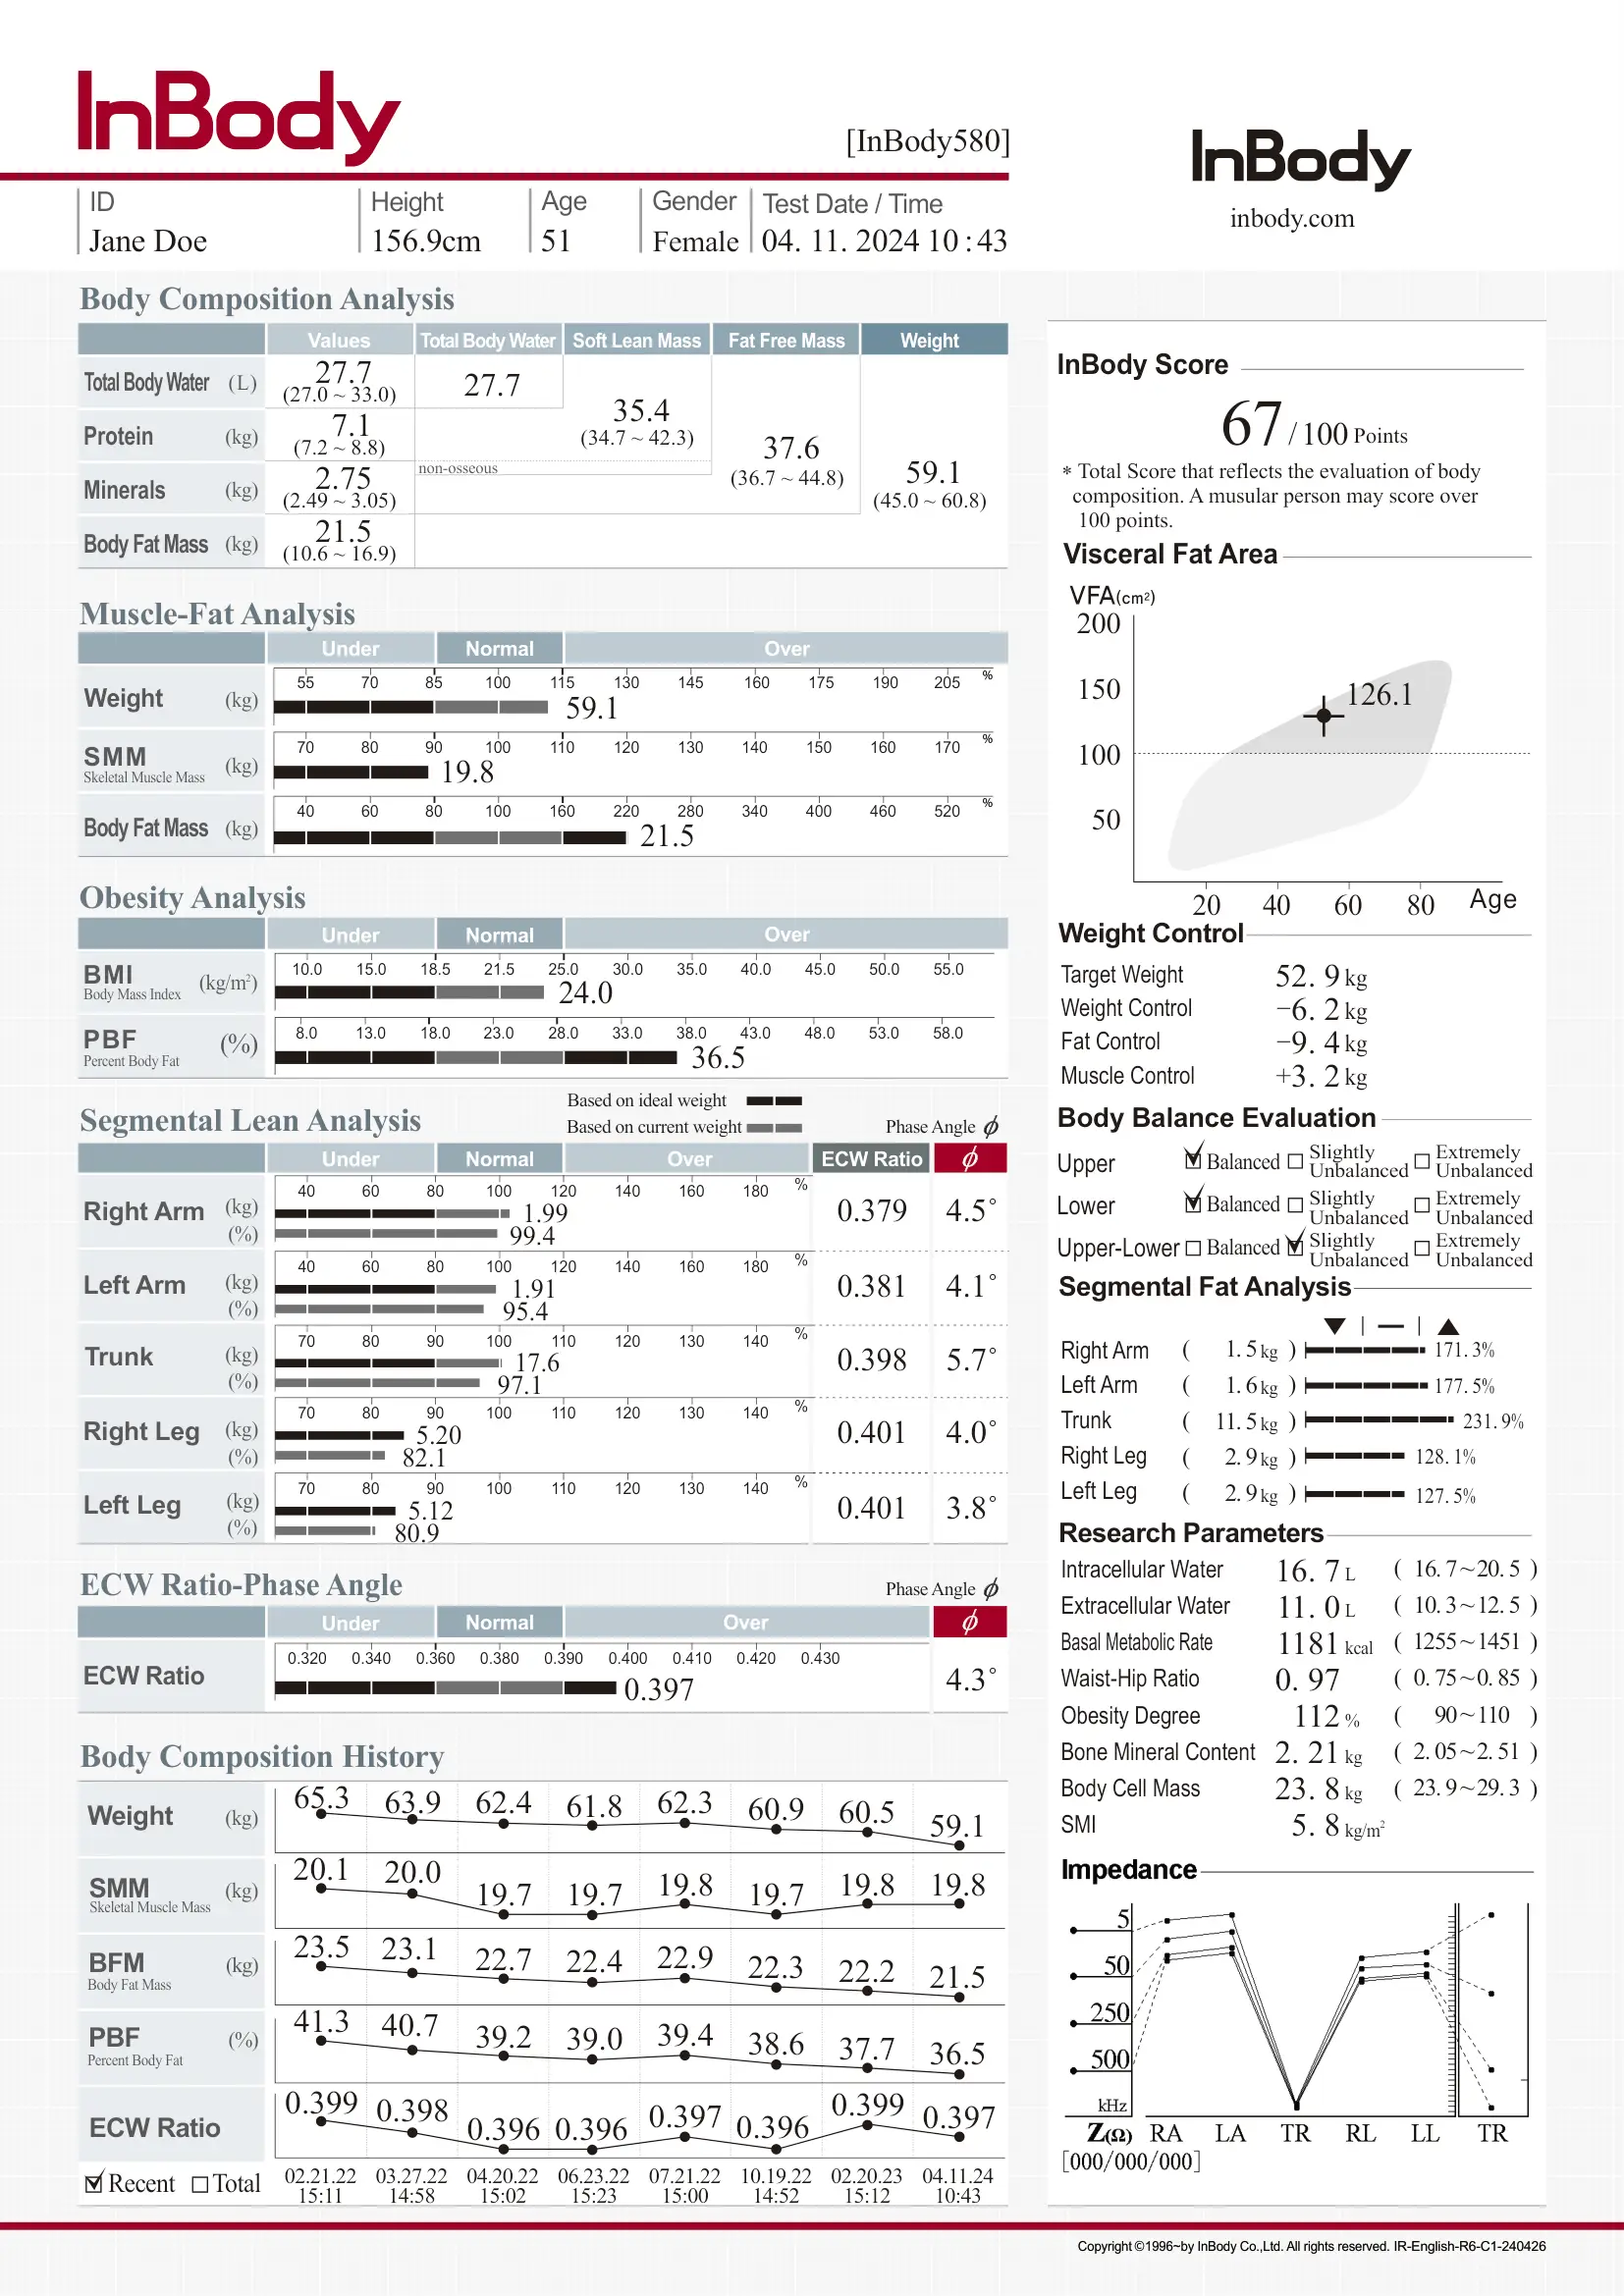
- Collect your result sheet. Your InBody result sheet is printed immediately. It shows all five key metrics: body fat percentage, skeletal muscle mass, visceral fat level, segmental lean analysis, and ECW/TBW ratio, alongside your InBody Score, a single composite number from 0–100.
SAFETY NOTE
InBody scanning is safe for most people. It is non-invasive, radiation-free, and takes under 60 seconds. The only exceptions are people with pacemakers or implanted defibrillators and pregnant women. If in doubt, consult your doctor before scanning.
Real Results: What Indian Users Experience With InBody
Body composition analysis is not just a clinical tool. In practice, it changes the way people approach their own health because it replaces vague, unmotivating numbers with specific, personal, and actionable data.
Case Example: The “Fit” Professional Who Was Not
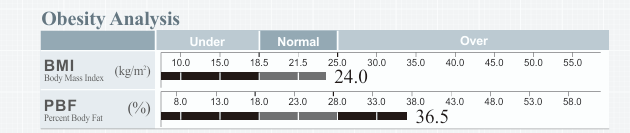
A 38-year-old marketing professional in Bengaluru had a BMI of 23.4. By every standard measure, she was in the healthy range. She exercised three times a week and ate a balanced vegetarian diet. Nevertheless, she felt consistently low on energy and had been told her fasting glucose was “borderline.”
Her InBody scan told a different story. Specifically, it revealed a Visceral Fat Level of 11 (high risk), Body Fat Percentage of 33.8% (obese by composition), and Skeletal Muscle Mass 2.6 kg below norm for her age and height. In other words, she was a textbook example of the thin-fat Indian phenotype, and BMI had missed it entirely.
After a 12-week programme of targeted resistance training and higher-protein meals designed around her InBody results, her next scan showed a visceral fat reduction of 3 units, a gain of 1.9 kg of muscle mass, and a normalisation of her fasting glucose. Consequently, her energy levels improved significantly and her doctor removed the borderline glucose flag.
| ↓3 units Visceral Fat Level reduction | +1.9 kg Skeletal Muscle Mass gained | ↓5.2% Body Fat Percentage reduction | Normal Fasting glucose at 12 weeks |
Who Should Get a Body Composition Scan?
Body composition analysis is relevant for almost everyone not just people who are overweight or unwell. In fact, the following groups benefit most from regular InBody scanning:
- People with a normal BMI but low energy or poor blood sugar:
Even if your BMI is healthy, you may still feel unwell. In such cases, a body composition scan can help. It shows whether hidden fat or low muscle is the real issue. - People trying to lose weight: Rather than tracking weight alone, InBody tells you whether you are losing fat or muscle, which makes all the difference to your long-term health.
- People who exercise regularly: Athletes and gym-goers need to track muscle gains and fat changes separately. BMI cannot do this. InBody can.
- People over 40: Muscle loss accelerates after 40 in Indian adults. Regular scanning helps detect decline early, before it becomes sarcopenia.
- People with prediabetes or metabolic syndrome: InBody provides the visceral fat and muscle mass data that doctors need to target treatment precisely.
- Corporate employees with sedentary lifestyles: Sitting for long hours drives visceral fat accumulation even in people who appear slim. Regular scanning identifies this early.
Frequently Asked Questions
Q. Is BMI completely useless?
BMI is a useful tool for studying large populations at a statistical level. However, it is a poor tool for assessing an individual’s fitness or metabolic health, especially for Indian patients. As a result, most leading health organisations now recommend body composition analysis as a supplement to, or replacement for, BMI in clinical assessments.
Q. How often should I get a body composition scan?
For most people, scanning every 8–12 weeks gives enough time for meaningful changes to show up in the data. However, if you are actively working on a fitness or weight-loss programme, scanning every 4–6 weeks allows you to track progress more precisely and adjust your plan accordingly.
Q. Is InBody scanning safe for elderly patients?
Yes. InBody scanning is non-invasive, radiation-free, and takes under 60 seconds. It is safe for most elderly patients and is specifically recommended as a sarcopenia screening tool by the Asian Working Group for Sarcopenia (AWGS), which uses Asian-specific reference values for muscle mass.
Q. Where can I get an InBody scan in India?
InBody scanners are available at leading hospitals, fitness centres, corporate wellness programmes, and sports medicine facilities across India, including Mumbai, Delhi, Bengaluru, Chennai, Hyderabad, and Pune. Find an InBody scanner near you. Scans typically take under 60 seconds, and results are available immediately.
Key Takeaways
- BMI was designed for population statistics, not for measuring individual fitness or metabolic health.
- Body fat percentage, skeletal muscle mass, visceral fat level, segmental lean analysis, and ECW/TBW ratio are the 5 metrics that truly define fitness.
- Indians are especially at risk from BMI’s blind spots. The thin-fat Indian phenotype means serious metabolic risk is routinely missed.
- InBody delivers all 5 key metrics in under 60 seconds at 98.4% accuracy compared to DEXA.
- Regular scanning every 8–12 weeks tracks the real impact of your diet and exercise programme with a precision that a weighing scale cannot match.
See What Your Body Is Really Made Of
An InBody scan takes under 60 seconds and gives you the body composition data your doctor needs to provide truly personalised, evidence-based care.

Find an InBody Scanner Near You
References & Further Reading
- International Diabetes Federation. IDF Diabetes Atlas, 10th Edition. Brussels: IDF, 2021.
- Yajnik CS, Yudkin JS. “The Y-Y paradox.” The Lancet. 2004;363(9403):163.
- WHO Expert Consultation. “Appropriate body-mass index for Asian populations.” The Lancet. 2004.
- DeFronzo RA, et al. “Skeletal muscle insulin resistance is the primary defect in type 2 diabetes.” Diabetes Care. 2009.
- Asian Working Group for Sarcopenia. “2019 Consensus Update.” JAMDA. 2020.
- Misra A, et al. “Consensus statement for diagnosis of obesity for Asian Indians.” JAPI. 2009.
- InBody Co. “Validation of InBody BIA against DEXA.” InBody White Paper Series. 2022.

Most trending articles
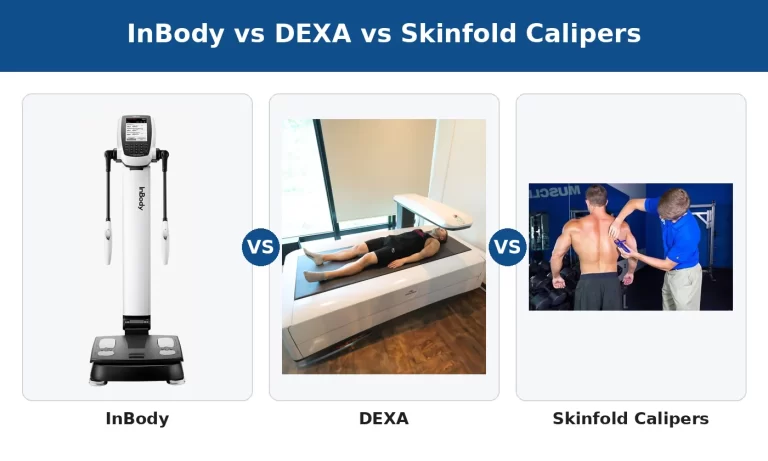
InBody vs DEXA vs Skinfold Calipers: Which Body Composition Test Is Right for You in India?
DEXA scans, InBody BIA, skinfold calipers — three different ways to measure body composition. Accuracy comparisons, cost in India, accessibility, and which method makes sense for your specific goal.

Skinny Fat in India: Why 40% of Normal Weight Indians Have Dangerously High Body Fat
India's hidden obesity epidemic. Skinny fat (TOFI — Thin Outside, Fat Inside) affects millions of normal-weight Indians. How body composition testing reveals what BMI hides — and the exact protocol to fix it.

Healthy Body Composition by Age for Indians: Reference Ranges at 20s, 30s, 40s, 50s+
Body composition reference ranges for Indian men and women by age. Find out if your body fat %, muscle mass, and visceral fat level are healthy for your age and what to do if they're not.