Body Composition 4 min read
Energy Expenditure & Metabolism: How the InBody 770 Measures BMR
Validated by Clinical Research in India Most people think metabolism is just about how fast you burn calories.But your body’s energy expenditure is far more complex, and understanding…
Reading about body composition? Find an InBody test centre near you →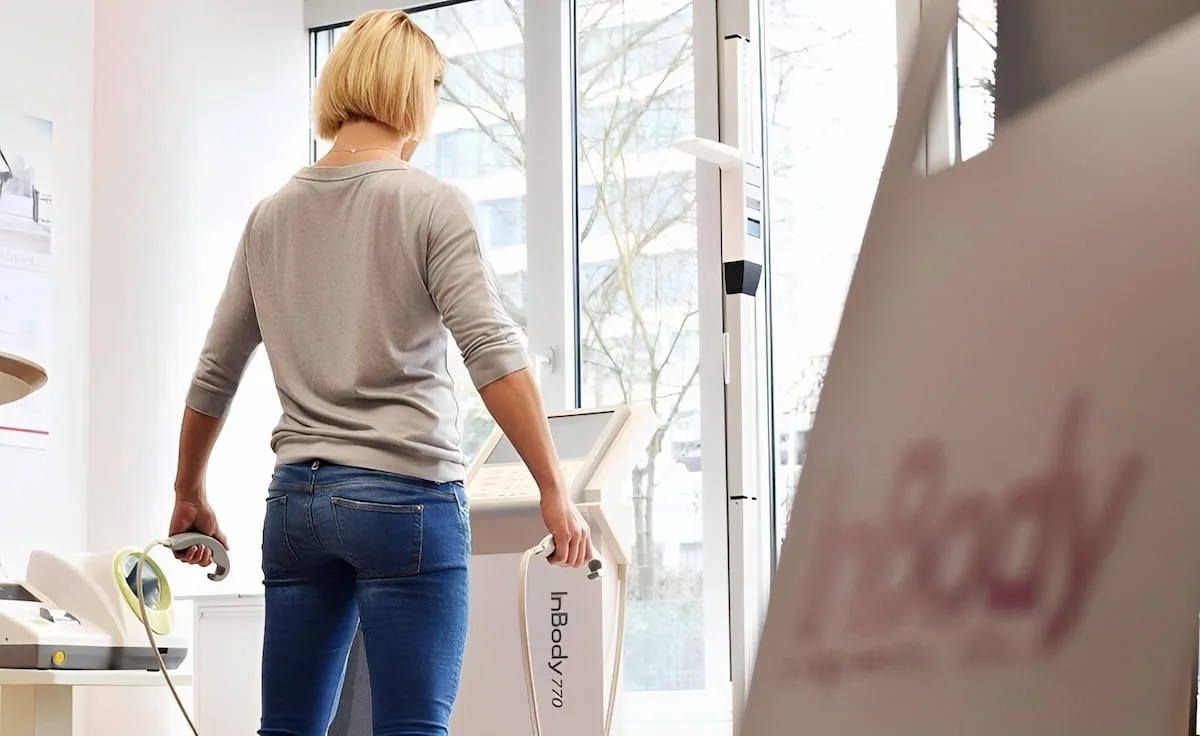
Validated by Clinical Research in India
Most people think metabolism is just about how fast you burn calories.
But your body’s energy expenditure is far more complex, and understanding it accurately can completely change the way you manage nutrition, performance, and recovery.
What Is Resting Energy Expenditure (REE)?
Your Resting Energy Expenditure (REE) represents the amount of energy your body needs to maintain basic functions like breathing, blood circulation, and cellular repair, even when you’re at rest. It’s the foundation of your metabolism and accounts for about 60–70% of total daily energy use.
Accurate REE measurement helps health professionals create personalised nutrition and weight management plans, detect metabolic issues early, and guide recovery strategies in clinical settings.
How InBody770 Measures Metabolism
Traditional methods like indirect calorimetry (IC) are accurate but often expensive, time-consuming, and difficult to access. The InBody770, however, provides a non-invasive, rapid, and validated alternative using advanced multi-frequency bioelectrical impedance analysis (BIA).
Key advantages:
- Estimates energy expenditure based on your unique body composition, not just weight or height.
- Offers real-time metabolic data within minutes.
- Enables population-specific insights for diverse ethnic and clinical groups.
- Provides a clinically comparable alternative to calorimetry at a fraction of the cost.
Backed by Clinical Evidence
A new peer-reviewed study published in the Cureus Journal of Medical Science (2024) by Dr. Sanjith Saseedharan, Dr. Amit Bhalerao, and Dr. Kalyani Badve from S.L. Raheja Hospital, Mumbai, evaluated the accuracy of the InBody770 against Indirect Calorimetry.
Study Design
- Participants: 50 obese Indian adults (BMI ≥ 25 kg/m²)
- Protocol: Both tests were performed under standardized fasting conditions.
- Goal: Compare REE values obtained from InBody770 and indirect calorimetry.
Results
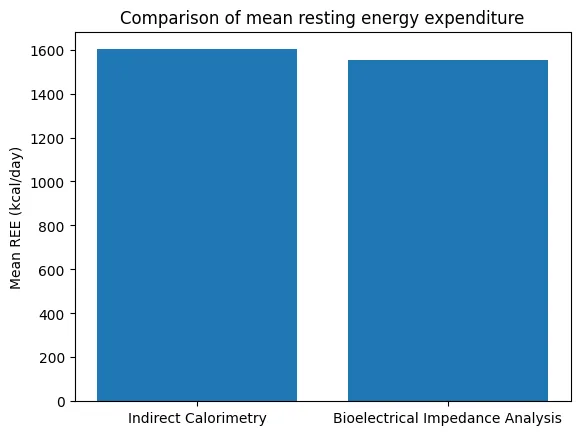
| Measurement Method | Mean REE (kcal/day) | Standard Deviation |
| Indirect Calorimetry | 1601.56 | 376.72 |
| InBody770 (BIA) | 1554.20 | 355.70 |
The analysis revealed a strong correlation (r = 0.918) and excellent concordance (CCC = 0.912) between the two methods confirming that InBody’s BIA technology can reliably estimate metabolic rate with near-calorimetric precision.
Visual Insights
Comparison of Average REE Values
The InBody770 produced results highly consistent with indirect calorimetry.
Correlation Between Both Methods
The scatter plot shows a clear positive correlation, indicating strong agreement between methods.

Why It Matters
Accurately knowing your Resting Energy Expenditure is essential for:
- Building customized nutrition plans based on real metabolic data.
- Preventing underfeeding or overfeeding during weight loss or clinical care.
- Supporting recovery in patients and optimizing performance in athletes.
- Understanding metabolic health changes over time.
Even small inaccuracies in estimating REE can have a significant impact on outcomes.
The InBody770 bridges the gap between accessibility and precision, helping clinicians and practitioners make informed, data-driven decisions.
Conclusion
This study reinforces that InBody’s multi-frequency BIA technology offers a scientifically validated, practical tool for metabolic assessment, especially in regions where indirect calorimetry is not readily available.
By combining body composition analysis, energy expenditure, and cellular health indicators (Phase Angle), the InBody770 provides a comprehensive view of human metabolism, empowering better decisions for nutrition, rehabilitation, and clinical care.
Learn More
InBody continuously supports research and innovation in the field of body composition and metabolism.
If you’re interested in a research collaboration or would like to request a demo, feel free to contact us!
References
- Amisi, C. A., Tchankou, C., Omole, J., & Alloh, F. T. (2022). Markers of insulin resistance in polycystic ovary syndrome. Frontiers in Endocrinology, 13, 867875.
- Jena, D., Sahoo, J., Gopalakrishnan, S., Behera, S., & Behera, P. (2018). Study of visceral and subcutaneous abdominal fat in polycystic ovarian syndrome. Journal of Human Reproductive Sciences, 11(3), 253–258.
- Barrea, L., Arnone, A., Annunziata, G., Muscogiuri, G., Laudisio, D., Salzano, C., Pugliese, G., Colao, A., & Savastano, S. (2021). Adherence to the Mediterranean diet, dietary patterns and body composition in women with polycystic ovary syndrome (PCOS)—Journal of Translational Medicine, 19, 372.
- Arpaci, D., Gürkan Tocoğlu, A., Yılmaz, S., Ergün, H., Tamer, A., & Ergün, H. (2015). The relationship between epicardial fat tissue thickness and visceral adipose tissue in lean patients with polycystic ovary syndrome. Journal of Ovarian Research, 8, 71.
- Atakul, T. (2020). Polycystic ovary syndrome in overweight and normal weight women: The relationships with inflammatory markers. Bosphorus Medical Bulletin, 5(3), 124–130.


Most trending articles
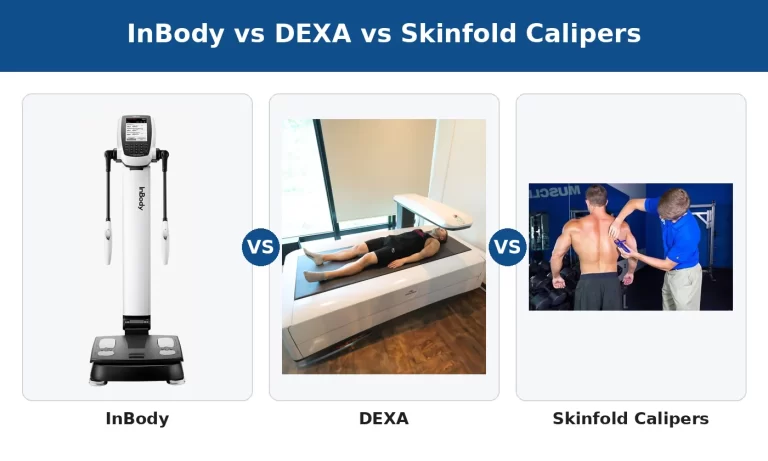
InBody vs DEXA vs Skinfold Calipers: Which Body Composition Test Is Right for You in India?
DEXA scans, InBody BIA, skinfold calipers — three different ways to measure body composition. Accuracy comparisons, cost in India, accessibility, and which method makes sense for your specific goal.
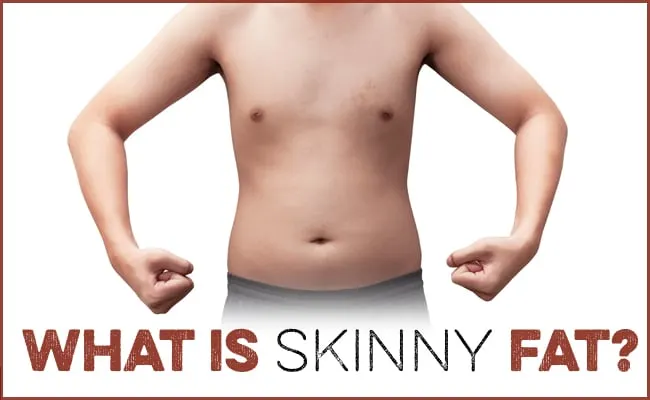
Skinny Fat in India: Why 40% of Normal Weight Indians Have Dangerously High Body Fat
India's hidden obesity epidemic. Skinny fat (TOFI — Thin Outside, Fat Inside) affects millions of normal-weight Indians. How body composition testing reveals what BMI hides — and the exact protocol to fix it.

Healthy Body Composition by Age for Indians: Reference Ranges at 20s, 30s, 40s, 50s+
Body composition reference ranges for Indian men and women by age. Find out if your body fat %, muscle mass, and visceral fat level are healthy for your age and what to do if they're not.