Body Composition 19 min read
Body Composition Analysis vs the Scale: 10 Key Differences
Your weight is a number. However, it is, in clinical terms, one of the least informative numbers you can have about your health. In fact, your weight tells…
Reading about body composition? Find an InBody test centre near you →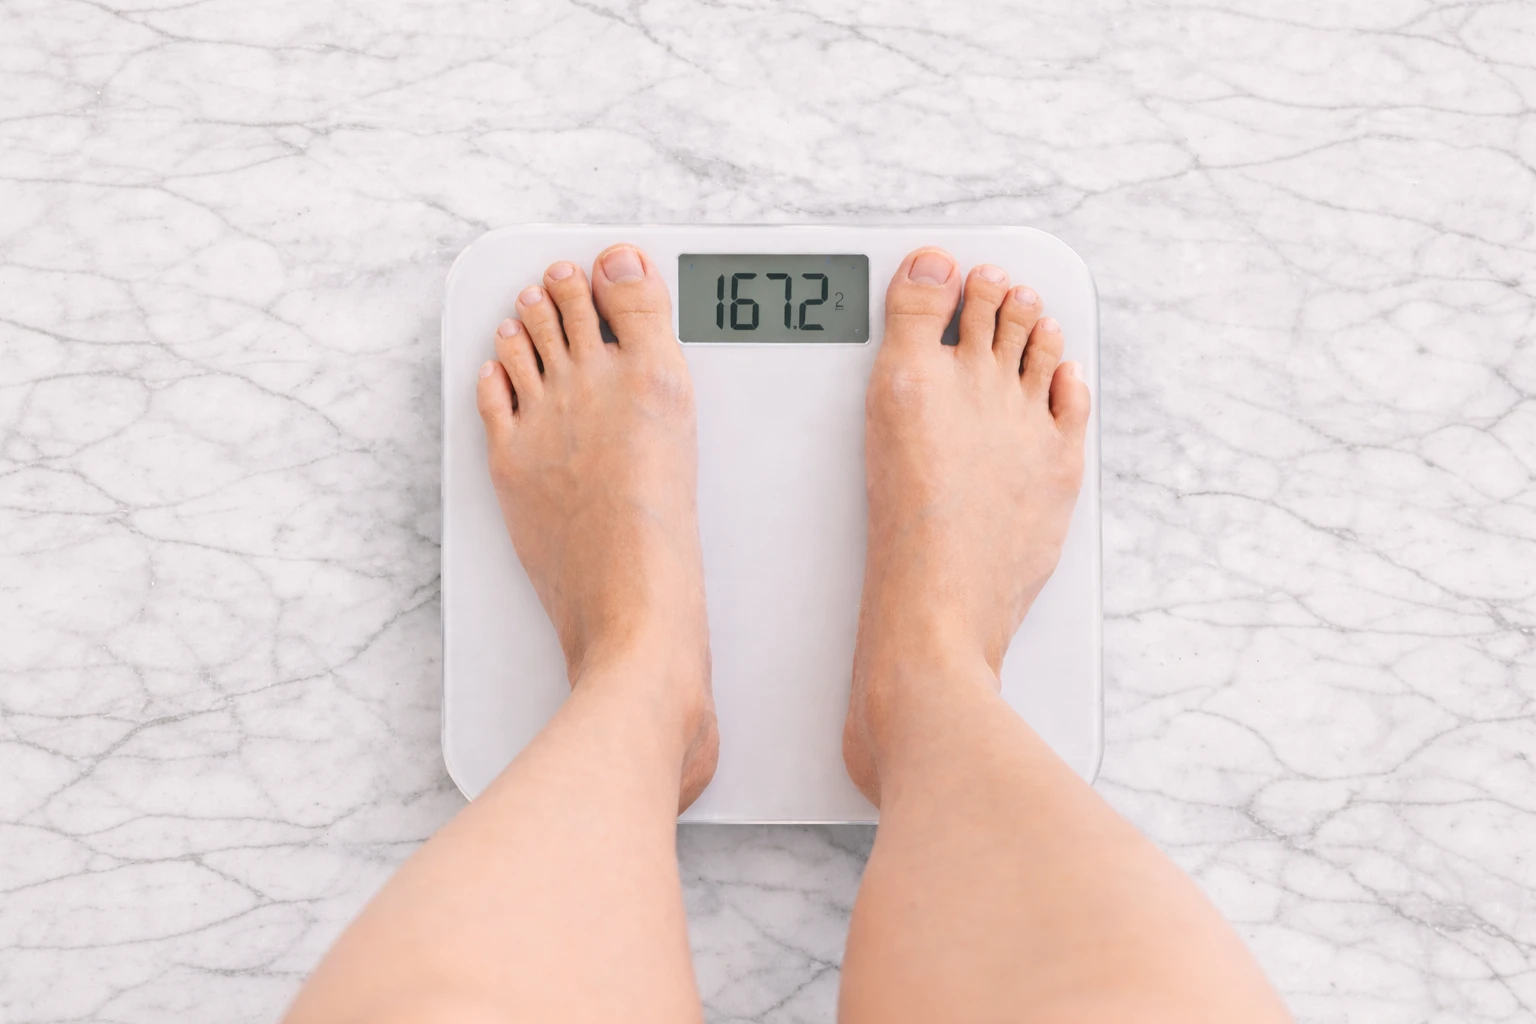
Your weight is a number. However, it is, in clinical terms, one of the least informative numbers you can have about your health. In fact, your weight tells you very little about your body. It does not show how much muscle you have. It also does not reveal where your fat is stored. More importantly, it cannot tell if your organs are surrounded by dangerous visceral fat. It also fails to show cell inflammation or early health risks. These include diabetes, heart disease, and sarcopenia.
As a result, many Indians receive normal-looking health reports every year. Their weight and BMI may appear fine. Their blood reports may also look borderline normal. However, hidden health risks may already be present. In many cases, these risks can lead to serious illness within the next 10 years.
This is where precision body scanning becomes important. InBody’s Direct Segmental Multi-frequency Bioelectrical Impedance Analysis (DSM-BIA) technology goes beyond basic tools. It provides insights that a scale, BMI chart, or standard blood test cannot offer, showing what your body is truly made of in just 60 seconds. It is also highly accurate, with up to 98.4% agreement with DEXA.
Furthermore, it measures 10 different health parameters. Each one reflects a unique aspect of your metabolic health. In this article, we will explore all 10 parameters. We will also explain the clinical importance behind each one. This helps patients, clinicians, and health professionals understand what standard tests often miss.
| 98.4% InBody DSM-BIA accuracy vs DEXA gold standard, peer-reviewed and validated | 10 Clinically distinct health markers revealed by a single 60-second InBody scan | 101M Indians living with Type 2 diabetes many undetected until organ damage occurs | 38% Of Indians with normal BMI found to have dangerous visceral fat on body scanning |
CLINICAL CONTEXT
This article is written for both medical professionals and informed patients. Each of the 10 precision body scan insights described below is supported by peer-reviewed clinical evidence. All markers are measured by InBody DSM-BIA technology, validated against DEXA, the clinical gold standard for body composition assessment. References are listed at the end of this article.
Why Standard Health Screening Misses What Matters Most
Before examining what a precision body scan reveals, it is important to understand why standard health screening in India is structurally inadequate for detecting the metabolic risks that most commonly drive serious disease. Standard health checks in India typically include weight, BMI, blood pressure, fasting glucose, and a lipid panel. Furthermore, some include a basic CBC and liver function test. However, none of these tools measures the two most critical drivers of metabolic disease: body fat distribution and skeletal muscle mass.
Moreover, in India specifically, the thin-fat phenotype documented by Professor C.S. Yajnik’s landmark research at KEM Hospital Pune means that a significant proportion of patients develop dangerous metabolic conditions at body weights and BMI values that standard screening classifies as healthy. As a result, the most at-risk Indian patients are systematically under-identified until their condition has progressed to overt disease. In contrast, a single InBody precision body scan at the initial clinical contact would identify these patients immediately in 60 seconds, without radiation, without discomfort, and without specialist input.
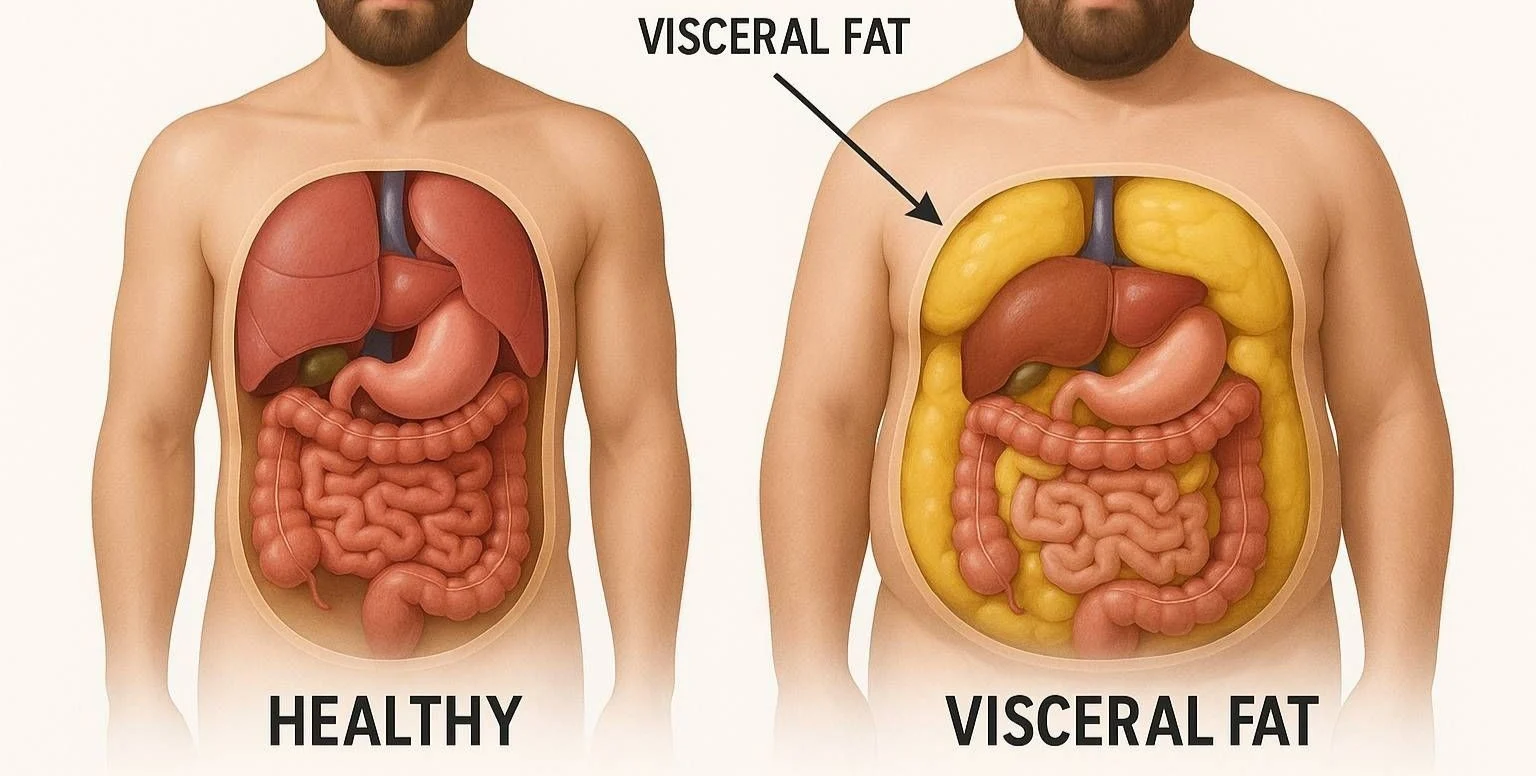
1. They Expose the Visceral Fat Your BMI Completely Hides
Visceral fat, the adipose tissue that accumulates around the liver, pancreas, and intestines, is the single most clinically significant body fat compartment. Unlike subcutaneous fat (the fat under your skin), visceral fat is metabolically active. Specifically, it continuously secretes pro-inflammatory cytokines, including TNF-α, IL-6, resisting, and leptin, which drive insulin resistance, hepatic inflammation, and cardiovascular plaque formation. Consequently, elevated visceral fat is a primary driver of Type 2 diabetes, non-alcoholic fatty liver disease (NAFLD), and ischaemic heart disease regardless of total body weight.
Furthermore, the relationship between visceral fat and metabolic risk is even more pronounced in Indian patients. In fact, South Asians accumulate visceral fat at significantly lower body weights than Western populations, meaning that an Indian patient with a BMI of 23 may carry a Visceral Fat Level of 10 or above, placing them firmly in the high-risk metabolic category. In contrast, a standard weighing scale or BMI measurement would classify this patient as completely healthy. Moreover, even a comprehensive blood panel cannot quantify visceral fat directly; it can only measure its downstream metabolic consequences after damage has already begun. As a result, InBody’s Visceral Fat Level (VFL) measurement is one of the most clinically irreplaceable markers the scan provides.
2. They Quantify Your True Muscle Mass, Not Just Your Weight
Skeletal muscle mass is arguably the most important and most underappreciated health metric in modern clinical practice. Specifically, skeletal muscle performs three functions that are directly relevant to metabolic disease prevention. First, it accounts for approximately 80% of insulin-stimulated glucose uptake, meaning that low muscle mass is an independent risk factor for Type 2 diabetes, completely separate from body fat levels. Second, it serves as the primary reservoir of glutamine, the essential fuel for immune cells, including lymphocytes and macrophages. Third, it produces anti-inflammatory myokines during contraction that directly regulate the immune response and reduce systemic inflammation.
Consequently, a patient with below-norm skeletal muscle mass faces compounded risks: poor glucose metabolism, impaired immunity, elevated systemic inflammation, and accelerated age-related functional decline. Moreover, these risks are invisible on a standard scale, because muscle loss is frequently masked by concurrent fat gain, meaning total body weight may remain stable even as body composition deteriorates dramatically. Therefore, InBody’s Skeletal Muscle Mass (SMM) measurement expressed in kg and compared against age- and sex-adjusted population norms provides clinical intelligence that no other bedside tool can offer.
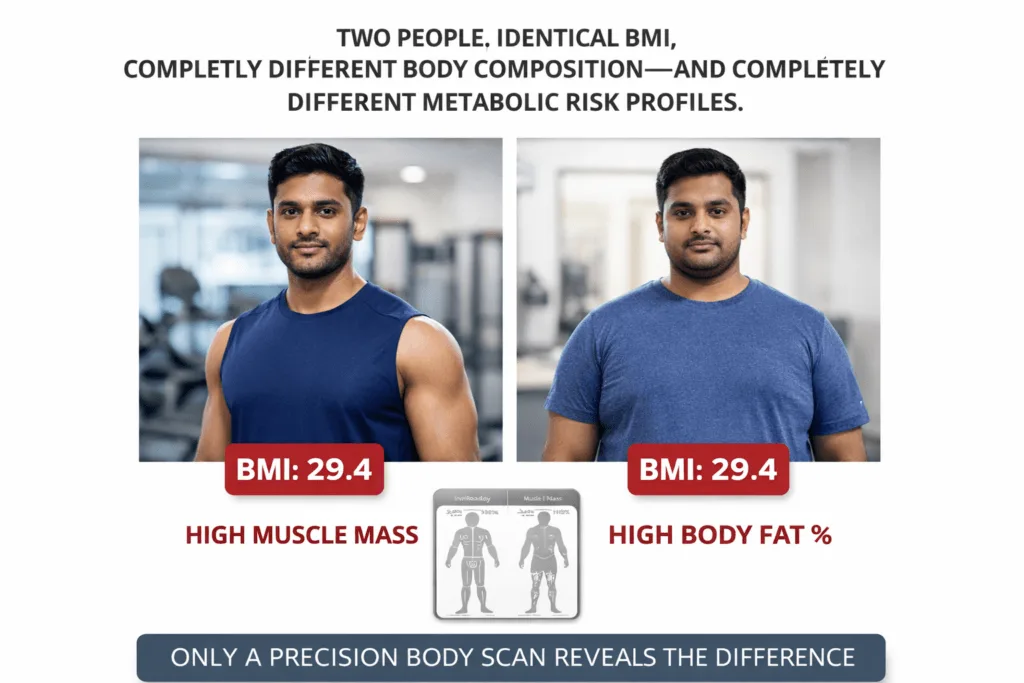
3. They Reveal Your Precise Body Fat Percentage With Indian-Specific Reference Ranges
Body fat percentage tells you what proportion of your total body mass is fat tissue. In clinical practice, this is a far more meaningful metric than BMI, because it directly quantifies the fat burden rather than inferring it from height-to-weight ratio. Furthermore, body fat percentage allows clinicians to identify patients who are “overfat” despite appearing slim the normal weight obesity phenotype that is endemic in the Indian population.
Specifically, the clinically significant body fat thresholds differ between populations. For Indian adults, a body fat percentage above 25% in men and above 35% in women is associated with significantly elevated metabolic risk thresholds that are lower than Western reference standards. Moreover, these thresholds occur in Indian patients at BMI values well below the standard obesity cut-off of 30. As a result, InBody’s Body Fat Percentage measurement applied with Asian-specific reference ranges identifies at-risk Indian patients who would pass a standard BMI-based health screening without any intervention flag.
4. They Map Where Your Fat Is Located Segment by Segment
Not all fat is equally dangerous. In fact, the location of fat in the body is as clinically significant as the total fat mass. Specifically, InBody’s segmental fat analysis measures fat distribution independently in each body segment: right arm, left arm, trunk, right leg, and left leg. Consequently, this reveals the android fat distribution pattern, upper-body and trunk-dominant fat accumulation, which is strongly associated with insulin resistance, cardiovascular disease, and metabolic syndrome, and which is the dominant fat distribution pattern in Indian adults of both sexes.
Furthermore, trunk fat mass is a significantly stronger predictor of hepatic insulin resistance than waist circumference in South Asian populations. Therefore, InBody’s segmental fat analysis particularly the trunk fat component, ,provides a more clinically precise risk stratification tool than tape measurement. In addition, tracking changes in trunk fat over time, in response to dietary and exercise interventions, gives clinicians objective data on whether the highest-risk fat compartment is genuinely responding to treatment.
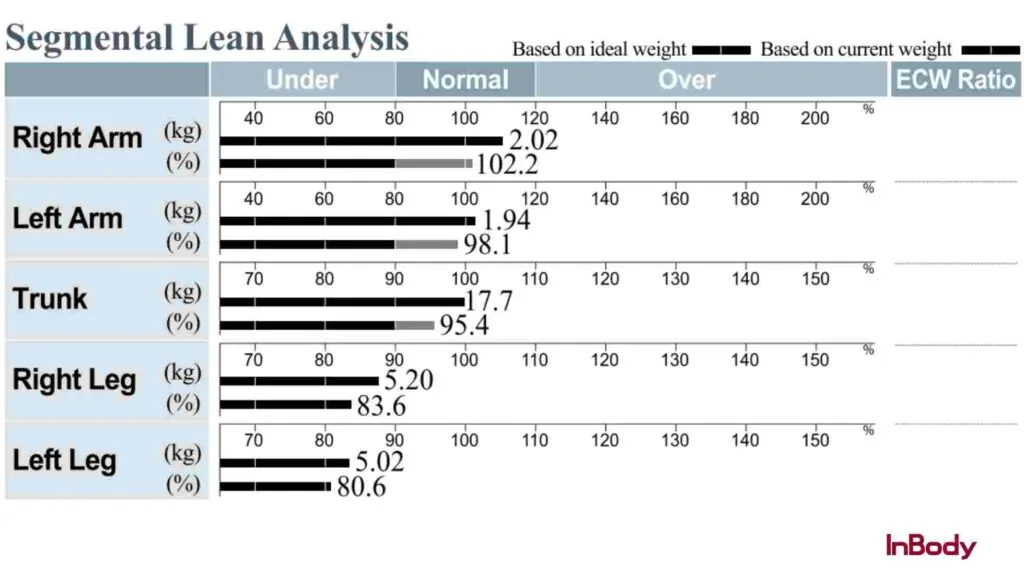
5. They Detect the Muscle Imbalances That Predict Injury Before It Happens
InBody’s segmental lean analysis measures skeletal muscle mass in each of the five body segments separately. This detailed approach helps identify muscle imbalances between the left and right sides, as well as between the upper and lower body. These imbalances are often missed in regular assessments.
In clinical practice, this level of detail is especially useful in three key situations.
First, for athletes and active individuals, even a small difference of 0.2 kg between the dominant and non-dominant limb can indicate a higher risk of injury. This is particularly important for Indian cricketers, tennis players, and runners, where one side of the body is used more intensely.
Second, for elderly patients, muscle loss in the legs is a major concern. Lower-than-normal quadriceps muscle mass is strongly linked to a higher risk of falls and loss of independence.
Third, for patients recovering from surgery or injury, segmental lean analysis helps track progress in the affected limb. It provides a clear and objective way to monitor recovery and decide when it is safe to return to normal activity.
6. They Measure Systemic Inflammation The Marker That Precedes Every Major Disease
The ECW/TBW ratio extracellular water to total body water, is one of the most clinically underutilised markers in preventive medicine. Specifically, this ratio reflects the distribution of body water between intracellular and extracellular compartments. A normal ratio is below 0.380. However, when this ratio rises above 0.390, it indicates cellular oedema, systemic inflammation, nutritional compromise, or active disease progression, all of which represent genuine clinical urgency, even when other markers appear normal.
Furthermore, the ECW/TBW ratio is elevated in a wide range of clinically significant conditions that are highly prevalent in India: metabolic syndrome, non-alcoholic fatty liver disease, post-COVID inflammatory states, protein-energy malnutrition, renal impairment, and heart failure. Moreover, in patients undergoing cancer treatment, a rising ECW/TBW ratio detectable weeks before clinical deterioration allows oncology teams to intervene nutritionally before muscle wasting becomes irreversible. Consequently, this single marker from an InBody precision body scan can be a decisive clinical signal across multiple specialities.
7. They Provide an Accurate Basal Metabolic Rate Essential for Nutrition Prescriptions
Basal Metabolic Rate (BMR), the number of calories your body burns at complete rest, is the foundation of any evidence-based nutrition prescription. However, population-formula BMR calculations, such as the Harris-Benedict equation, have significant accuracy limitations when applied to Indian patients, because they were developed on Western populations with different muscle mass distributions and metabolic rates. As a result, standard BMR calculations can produce errors of 200–400 kcal/day in Indian patients, enough to render a dietitian’s caloric prescription clinically meaningless.
In contrast, InBody calculates BMR directly from measured lean body mass, specifically from skeletal muscle mass, which is the primary driver of resting metabolic rate. Consequently, InBody-derived BMR is both population-independent and individually precise. Furthermore, tracking BMR changes over time reveals whether a weight-loss intervention is preserving muscle (BMR maintained or increasing) or causing muscle loss (BMR declining), a distinction that is clinically critical but invisible on a standard scale.
8. They Track the Sarcopenia Trajectory Before It Becomes Irreversible
Sarcopenia, clinically defined as skeletal muscle mass index (SMI) below 7.0 kg/m² in men and 5.4 kg/m² in women by the Asian Working Group for Sarcopenia (AWGS), is a progressive condition that begins decades before it causes visible functional impairment. In India specifically, sarcopenia is driven by protein-deficient diets, sedentary lifestyles, and the accelerated muscle loss that accompanies the Indian metabolic phenotype. Furthermore, the AWGS specifically uses Asian-population reference values because Western sarcopenia thresholds systematically underdiagnose the condition in Indian and South Asian patients.
Therefore, InBody’s Skeletal Muscle Index measurement available directly from the scan result sheet allows clinicians to identify patients on a sarcopenic trajectory years before they meet the diagnostic threshold. In practice, this means that the 45-year-old patient who is currently borderline-low in muscle mass can receive targeted protein and resistance training interventions now, preventing the falls, fractures, metabolic deterioration, and loss of functional independence that sarcopenia causes in the sixth and seventh decades of life. In addition, annual or six-monthly InBody scans allow clinicians to track the trajectory and confirm that interventions are genuinely arresting muscle loss.
9. They Provide a Single Composite Score That Tracks Your Health Over Time
The InBody Score is a composite index from 0 to 100 that integrates skeletal muscle mass and body fat percentage into a single, easily communicated number reflecting overall muscle-fat balance. A score of 80 or above indicates an optimal muscle-fat ratio. Moreover, tracking the InBody Score over serial scans at 8–12 week intervals provides an objective, motivating measure of whether a patient’s health is genuinely improving in response to lifestyle, dietary, or pharmacological interventions.
Furthermore, in clinical practice, the InBody Score serves a purpose beyond data it serves as a patient engagement tool. Specifically, patients who can see a tangible, improving number are significantly more likely to maintain compliance with diet and exercise programmes than those who receive only abstract clinical advice. As a result, the InBody Score directly addresses the compliance gap that is the primary barrier to preventive care effectiveness in the Indian clinical context.
10. They Reveal the Hidden Truth That GLP-1 Medications and Weight-Loss Drugs Are Hiding
GLP-1 receptor agonists semaglutide, liraglutide, and their equivalents are increasingly prescribed in India for Type 2 diabetes and obesity management. However, clinical evidence shows that without concurrent resistance training and adequate protein intake, up to 40% of weight lost on GLP-1 medications can come from lean tissue rather than fat. This is a major clinical problem: the patient’s weight on the scale decreases, their doctor is satisfied, and meanwhile, their muscle mass is declining, and their long-term metabolic resilience is actually worsening.
Consequently, InBody precision body scanning is now considered an essential monitoring tool for all patients on GLP-1 and weight-loss pharmacotherapy. Specifically, serial scans at baseline, 3, 6, and 12 months allow clinicians to distinguish fat loss from muscle loss, ensuring that the medication is producing genuine body composition improvement rather than simply reducing the scale reading at the cost of lean tissue. Moreover, when muscle loss is detected early through InBody monitoring, the intervention is straightforward: increase protein targets, add resistance training, and adjust the pharmacological dose. In other words, the InBody scan doesn’t just reveal the problem; it enables the solution before the damage becomes irreversible.
All 10 Precision Body Scan Markers: Clinical Reference Table
The following table summarises all 10 health markers revealed by an InBody precision body scan, the clinical significance of each, and the action threshold for Indian patients.
| S.No. | Marker | What It Reveals | Indian-Specific Action Threshold | Available On |
|---|---|---|---|---|
| 1 | Visceral Fat Level (VFL) | Fat surrounding internal organs primary driver of T2DM, NAFLD, CVD | VFL ≥10 = high risk; VFL ≥13 = clinical referral indicated | All models |
| 2 | Skeletal Muscle Mass (SMM) | Total lean muscle in kg vs age/sex norm immunity and glucose disposal | Below norm = T2DM risk; >2 kg below = active sarcopenia intervention | All models |
| 3 | Body Fat Percentage (PBF) | Proportion of total weight that is fat distinguishes true obesity from BMI obesity | >25% men / >35% women (Indian-specific lower than Western norms) | All models |
| 4 | Segmental Fat Analysis | Fat mass per limb and trunk reveals android vs gynoid distribution | Trunk fat elevated = hepatic insulin resistance risk; android pattern = CVD risk | 570, 770, 970 |
| 5 | Segmental Lean Analysis | Muscle mass per limb and trunk reveals imbalances and deficits | ≥0.2 kg asymmetry = injury risk; leg deficit = fall risk and glucose disposal impairment | All models |
| 6 | ECW/TBW Ratio | Systemic inflammation, cellular oedema, nutritional status | ≥0.390 = active inflammation or nutritional compromise; ≥0.400 = urgent clinical review | 570, 770, 970 |
| 7 | Basal Metabolic Rate (BMR) | Measured resting caloric burn from lean mass nutrition prescription baseline | Declining BMR over serial scans = muscle loss from dietary restriction or GLP-1 therapy | All models |
| 8 | Skeletal Muscle Index (SMI) | Height-adjusted muscle mass AWGS sarcopenia diagnostic criterion | <7.0 kg/m² men / <5.4 kg/m² women (AWGS Asian-specific threshold) | All models |
| 9 | InBody Score (0–100) | Composite muscle-fat balance index patient engagement and progress tracking | ≥80 = optimal; <70 = active intervention indicated; track trend over 8–12 week cycles | All models |
| 10 | Lean-to-Fat Change Ratio | On serial scans distinguishes fat loss from muscle loss during weight loss therapy | >40% weight loss from lean tissue = GLP-1 / diet protocol adjustment required | All models (serial scan) |
Real-World Case: What a Precision Body Scan Found That 3 Years of Standard Checks Missed
A 44-year-old female accountant in Hyderabad had attended annual corporate health checks for three consecutive years. Each year, her results came back reassuring: BMI 23.1, fasting glucose 5.1 mmol/L (normal), cholesterol within range, blood pressure 118/76 mmHg. Consequently, she was classified as low metabolic risk and received no intervention recommendations.
However, she reported persistent fatigue, increasing difficulty managing her weight despite no change in diet, and a family history of Type 2 diabetes on both sides. As a result, her physician requested an InBody 770 precision body composition scan. The results were clinically striking.
Specifically, the scan revealed: Visceral Fat Level 12 (high risk 3 units above the intervention threshold), Body Fat Percentage 37.4% (significantly above the Indian-specific female threshold of 35%), Skeletal Muscle Mass 2.9 kg below the population norm for her age and height, and an ECW/TBW ratio of 0.392 (elevated, indicating subclinical systemic inflammation). Furthermore, her InBody Score was 61, below the 70-point active intervention threshold. In other words, three years of standard health checks had classified her as healthy while all four primary metabolic risk markers were significantly outside normal ranges.
Subsequently, a 16-week structured programme was initiated: a protein target of 1.2 g/kg/day, progressive resistance training three times per week, and a 500 kcal daily deficit targeting fat loss without muscle compromise. At the 16-week InBody follow-up scan, the results confirmed genuine metabolic improvement across all four risk markers.
| VFL 12 → 8 Visceral Fat Level dropped 4 units out of high-risk zone | +2.4 kg SMM Skeletal Muscle Mass gained BMR increased by 89 kcal/day | PBF 37.4% → 31.2% Body Fat Percentage reduced by 6.2 percentage points | Score 61 → 74 InBody Score improved 13 points into active-healthy zone |
In addition, her fasting glucose at the 16-week clinical review had reduced to 4.7 mmol/L, and her fatigue symptoms had resolved completely. This case illustrates the core clinical argument for precision body scanning: standard health screening did not fail because of negligence; it failed because it was not designed to see what InBody sees.
Who Should Get a Precision Body Scan And How Often
A precision body scan using InBody technology is clinically indicated for a broad range of patients and contexts. Specifically, the following groups benefit most from regular scanning and represent the primary target for proactive body composition monitoring in India.
- Adults over 35 with a family history of diabetes, cardiovascular disease, or metabolic syndrome: These patients are at highest risk from the thin-fat Indian phenotype and should be scanned annually at minimum, regardless of current BMI or blood panel status.
- Patients on GLP-1 receptor agonists or weight-loss pharmacotherapy: Serial scans at baseline, 3, 6, and 12 months are clinically essential to distinguish fat loss from muscle loss and adjust the therapeutic protocol accordingly.
- Post-COVID patients with persistent fatigue or functional impairment: ECW/TBW ratio and SMM monitoring provide objective data on inflammatory trajectory and muscle recovery, both critical for long COVID management.
- Athletes and active individuals at any level: Segmental lean analysis, SMM tracking, and InBody Score monitoring allow coaches and sports medicine clinicians to optimise training load, detect overtraining, and identify injury risk before it manifests.
- Elderly patients over 60: SMI monitoring against AWGS thresholds, segmental leg muscle analysis, and ECW/TBW ratio tracking form the clinical foundation of evidence-based sarcopenia prevention and management in India’s ageing population.
- Corporate employees in sedentary roles: Annual InBody scanning in workplace wellness programmes identifies employees with clinically significant visceral fat accumulation and metabolic risk at a stage when dietary and exercise interventions can reverse the trajectory completely.
- Patients in oncology, nephrology, or post-surgical care: ECW/TBW ratio and serial SMM monitoring provide objective nutritional status and inflammatory burden data that directly guide clinical decision-making in these high-complexity patient groups.
RECOMMENDED SCANNING FREQUENCY BY CLINICAL CONTEXT
General health monitoring (adults 35+): Every 6–12 months
Active weight management or fitness programme: Every 8–12 weeks
GLP-1 / pharmacotherapy monitoring: Baseline + every 3 months
Post-COVID recovery: Baseline + every 6–8 weeks until ECW/TBW normalises
Sarcopenia prevention (adults 60+): Every 6 months
Elite athletic performance: Every 4–6 weeks during competitive season
Oncology/nephrology nutritional monitoring: Monthly or as clinically indicated
How to Prepare for an InBody Precision Body Scan
To obtain the most clinically accurate InBody scan results, the following preparation guidelines should be followed. Adhering to these conditions ensures that the impedance measurements reflect true body composition rather than transient physiological fluctuations.
- Fast for 2–3 hours before scanning. Food and drink in the gastrointestinal tract affect body water distribution and can alter impedance readings. Water consumed more than 2 hours before scanning does not significantly affect results.
- Avoid exercise for at least 12 hours before scanning. Exercise causes transient fluid shifts into exercised muscle compartments, temporarily reducing body fat percentage readings below true values.
- Empty the bladder immediately before stepping on the device. Bladder contents are measured as body water and can add meaningless weight to the scan reading.
- Remove shoes, socks, and all footwear. Direct electrode contact with the soles of both feet is required for accurate current transmission through the lower body segments.
- Scan at the same time of day for all serial measurements. Body water levels follow a circadian rhythm. Consistent scan timing ideally morning, before breakfast eliminates this variable across serial assessments.
- Remove all metal jewellery and accessories. Metal objects can interfere with electrical impedance measurement, particularly in the upper body segments.
- Women should avoid scanning during menstruation if possible. Hormonal fluid retention during the menstrual cycle can temporarily elevate body water readings, affecting ECW/TBW ratio and body fat percentage results.

Frequently Asked Questions
InBody DSM-BIA technology is clinically validated against DEXA, the gold standard for body composition, showing 98.4% accuracy in research studies. It uses Direct Segmental Multi-frequency BIA, measuring five body segments with multiple frequencies, delivering clinical-grade accuracy without radiation or long scan times.
No—an InBody body composition analyzer does not replace clinical tests. It complements standard assessments by providing additional data such as visceral fat, skeletal muscle mass, segmental analysis, and ECW/TBW ratio—metrics not available in routine pathology tests. For the most complete evaluation, clinicians combine body composition analysis with blood tests, blood pressure readings, and patient history.
InBody Body Composition Analyzer scanning is safe for most patients, including those with diabetes, hypertension, cardiovascular disease, renal issues, and cancer. It uses a very low, painless electrical current and is non-invasive and radiation-free. The only contraindications are pregnancy or implanted electronic devices such as pacemakers or defibrillators.
Consumer body fat scales use single-frequency, foot-to-foot BIA, estimating upper body composition with population formulas and often showing 5–15% accuracy variation. In contrast, InBody uses multi-frequency, segmental analysis across five body parts, directly measuring clinical markers like Visceral Fat Level, ECW/TBW ratio, SMI, and segmental lean mass—making it a true clinical assessment, not just an estimate.
InBody precision body scanners are available across hospitals, diabetes clinics, sports medicine centres, corporate wellness programs, and premium fitness facilities throughout India. Find an InBody scanner near you at inbody. in, or contact InBody India for institutional deployment in hospitals, clinics, or corporate wellness programs.
Key Takeaways
- Standard health screening in India, including weight, BMI, and blood panel, misses the two most critical drivers of metabolic disease: visceral fat distribution and skeletal muscle mass. A precision body scan measures both.
- An InBody scan reveals 10 clinically distinct health markers: visceral fat level, skeletal muscle mass, body fat percentage, segmental fat and lean analysis, ECW/TBW ratio, BMR, SMI, InBody score, and lean-to-fat change ratio in a single 60-second, radiation-free assessment.
- The thin-fat Indian phenotype, with normal BMI masking high visceral fat and low muscle mass, is endemic in India and is only detectable through body composition analysis.
- GLP-1 and weight-loss medication patients require serial InBody monitoring to ensure weight loss is coming from fat, not from the muscle mass that determines long-term metabolic health.
- InBody DSM-BIA accuracy is 98.4% vs DEXA, validated in peer-reviewed research, making it the most clinically credible non-invasive body composition assessment available at bedside.
- Recommended scanning frequencies range from monthly (oncology, nephrology) to annual (general health monitoring), with 8–12 week cycles the standard for active weight management and fitness programmes.
Discover What Your Standard Health Check Has Been Missing
An InBody precision body scan takes 60 seconds. It costs a fraction of a standard health check. And it reveals the 10 health markers that your weighing scale, your BMI chart, and your blood panel have never been able to show you. That is not a claim; it is the clinical evidence, documented across 30 years of peer-reviewed research.
Find an InBody Scanner Near You
References & Clinical Sources
- International Diabetes Federation. IDF Diabetes Atlas, 10th Edition. Brussels: IDF, 2021.
- Yajnik CS, Yudkin JS. “The Y-Y paradox.” The Lancet. 2004;363(9403):163.
- WHO Expert Consultation. “Appropriate body-mass index for Asian populations.” The Lancet. 2004;363(9403):157–163.
- DeFronzo RA, et al. “Skeletal muscle insulin resistance is the primary defect in type 2 diabetes.” Diabetes Care. 2009.
- Asian Working Group for Sarcopenia. “2019 Consensus Update on Sarcopenia Diagnosis and Treatment.” JAMDA. 2020.
- Misra A, et al. “Consensus statement for diagnosis of obesity and metabolic syndrome for Asian Indians.” JAPI. 2009.

Most trending articles

InBody vs DEXA vs Skinfold Calipers: Which Body Composition Test Is Right for You in India?
DEXA scans, InBody BIA, skinfold calipers — three different ways to measure body composition. Accuracy comparisons, cost in India, accessibility, and which method makes sense for your specific goal.

Skinny Fat in India: Why 40% of Normal Weight Indians Have Dangerously High Body Fat
India's hidden obesity epidemic. Skinny fat (TOFI — Thin Outside, Fat Inside) affects millions of normal-weight Indians. How body composition testing reveals what BMI hides — and the exact protocol to fix it.

Healthy Body Composition by Age for Indians: Reference Ranges at 20s, 30s, 40s, 50s+
Body composition reference ranges for Indian men and women by age. Find out if your body fat %, muscle mass, and visceral fat level are healthy for your age and what to do if they're not.