Body Composition 7 min read
How to Read Your InBody Results Sheet — Every Metric Explained
You just stepped off the InBody analyser. The technician hands you a printed sheet covered in bars, numbers, and a dozen acronyms. Most people glance at the body…
Reading about body composition? Find an InBody test centre near you →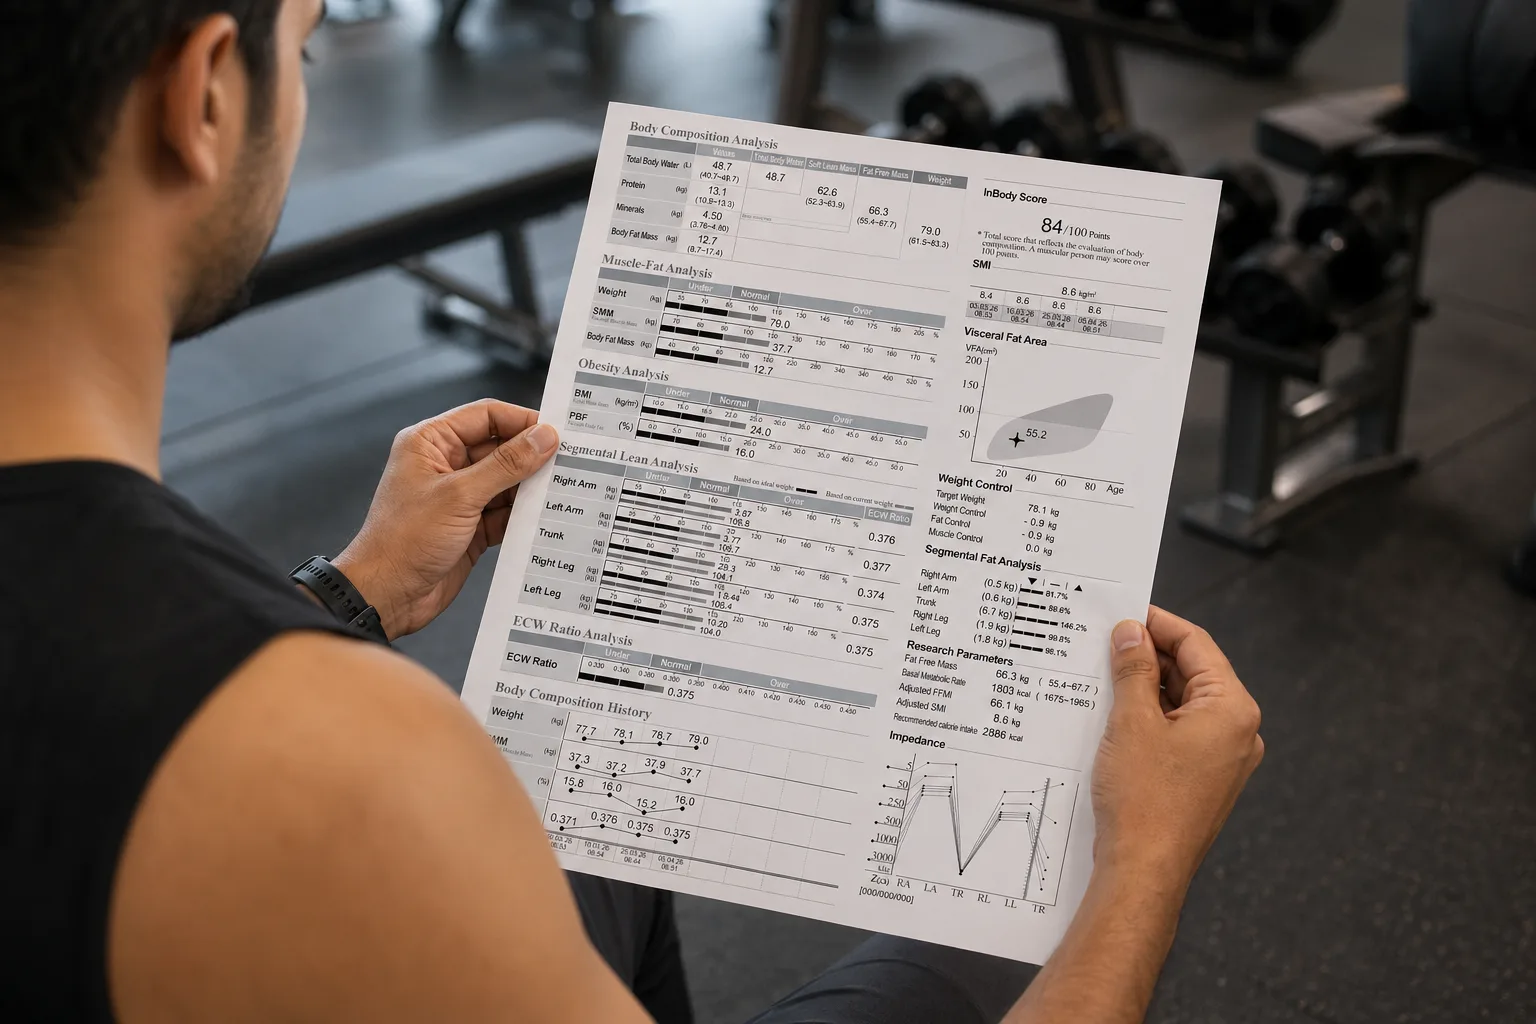
You just stepped off the InBody analyser. The technician hands you a printed sheet covered in bars, numbers, and a dozen acronyms. Most people glance at the body fat percentage, take a photo, and forget the rest.
That’s a missed opportunity. Your InBody Result Sheet is one of the most detailed body composition reports you can get without an MRI, and once you understand each section, you can use it to track real progress, fix specific health risks, and set training goals that actually mean something.
This guide walks through every section of an InBody Result Sheet in plain English. Read it once, and you will never look at that sheet of paper the same way again.
What is on an InBody Result Sheet?
Most modern InBody analysers (the InBody 270, 380, 570, 580, 770s, and 970s) print a single A4 sheet with about ten distinct sections. Each section answers a different question about your body.
The sections are arranged from top to bottom roughly in order of clinical importance:
- Body Composition Analysis: how your weight breaks down into water, protein, minerals, and fat
- Muscle-Fat Analysis: bar chart of weight, skeletal muscle mass, and body fat mass
- Obesity Analysis: BMI and per cent body fat
- Segmental Lean Analysis: muscle in each arm, leg, and trunk
- ECW/TBW Ratio: body water balance, the inflammation indicator
- Visceral Fat Level: the dangerous fat around your organs
- Body Composition History: trend chart of your last 8 scans
- InBody Score: your overall body composition grade out of 100
- Basal Metabolic Rate (BMR): your daily calorie burn at rest
- Body Composition Recommendations: suggested fat loss or muscle gain targets
Let’s go through each.
1. Body Composition Analysis

The top section breaks your total body weight into four components: Total Body Water, Protein, Minerals, and Body Fat Mass. The water itself is split further into Intracellular Water (water inside cells) and Extracellular Water (water outside cells, in blood and between tissues).
Why it matters: Your body is roughly 60% water. If your total body water drops sharply between scans, you may be dehydrated or losing muscle. If your extracellular water rises, you may be retaining fluid (oedema), which can be a sign of inflammation, kidney issues, or excess sodium.
What to look for: Total body water around 50–65% of body weight is normal. Intracellular water should account for the majority of your total body water (about 60–65% of total body water).
2. Muscle-Fat Analysis

This is the bar chart most people look at first. Three horizontal bars show your Weight, Skeletal Muscle Mass (SMM), and Body Fat Mass, with a normal range marked.
The shape these bars form tells a story:
- D-shape (weight and fat above normal, muscle below): overweight with low muscle, typical of sedentary lifestyles. The top priority is to build muscle while reducing fat.
- I-shape (all three around normal): balanced body composition.
- C-shape (high muscle, low fat): athletic build. The goal is to maintain.
- Inverted-D / Strong (high weight, high muscle, low fat): a strength-trained body that may show as “obese” on BMI but is actually lean.
Why it matters: A scale tells you nothing about whether your weight is muscle or fat. The Muscle-Fat bars do.
3. Obesity Analysis
Two numbers here: BMI (Body Mass Index) and PBF (Per cent Body Fat).
BMI is the same height-and-weight calculation you have seen elsewhere. PBF is what makes this section useful: the percentage of your total body weight that is fat.
Healthy ranges (Indian context):
- Men: 10–20% body fat (athletic), 20–25% (acceptable), 25%+ (high risk)
- Women: 18–28% body fat (athletic to acceptable), 30%+ (high risk)
Why it matters: BMI fails to distinguish a 75 kg lean athlete from a 75 kg sedentary person with high body fat. PBF tells you what BMI cannot.
4. Segmental Lean Analysis

Five horizontal bars, one for each arm, each leg, and the trunk, show how much muscle is in each segment compared to what is expected for your height and gender.
Each bar shows two values: the absolute muscle mass in kg, and the percentage of expected muscle for your body size.
Why it matters: This is where lifters, athletes, and rehab patients learn the most. Imbalances between the left and right arm or left and right leg show up immediately. A leg that is below 100% of expected after an injury is a clear rehab target.
What to look for: Each segment ideally over 100% of expected. Differences between left and right within 5% are normal; bigger gaps may need attention.
5. ECW/TBW Ratio: the body water balance score
Extracellular Water divided by Total Body Water. Sounds technical. In practice, it is one of the most underused numbers on the sheet.
Healthy ECW/TBW ratio: 0.36 to 0.39.
Why it matters: A ratio above 0.39 means you have more water outside your cells than is normal. This often indicates inflammation, oedema, kidney stress, or excess sodium intake. Many dialysis units use this number as their primary clinical input.
If your ECW/TBW is creeping up between scans, that is a signal worth investigating.
6. Visceral Fat Level (VFL)
A single number from 1 to 20+. This is the fat around your organs, the dangerous one.
- 1 to 9: healthy
- 10 to 14: high meaningful cardiovascular and metabolic risk
- 15+: very high clinically actionable
Why it matters: Visceral fat is independently linked to type 2 diabetes, cardiovascular disease, fatty liver, and metabolic syndrome. You can have a normal BMI and still have a dangerous visceral fat level, the so-called skinny fat profile.
If your VFL is above 9, this is the single most important number on your sheet.
7. Body Composition History

A trend chart of weight, SMM, and PBF across your last several scans (typically up to eight). The lines tell you whether you are gaining muscle, losing fat, both, neither, or going the wrong way.
Why it matters: Single scans give you a snapshot. The history chart gives you direction. Most progress is invisible scan to scan, but obvious over three to four scans.
8. InBody Score
A single composite score from 0 to 100 is InBody’s overall grade of your body composition.
- Below 70: room to improve
- 70 to 80: average to good
- 80 to 90: very good (typical of trained individuals)
- 90+: excellent (typical of athletes)
Why it matters: The InBody Score is the easiest number to track over time. It rises if you build muscle, lose fat, and balance your body water, so it is a clean overall progress indicator.
9. Basal Metabolic Rate (BMR)
The number of calories your body burns at complete rest in 24 hours. Calculated from your skeletal muscle mass, not just body weight, which is why an InBody BMR is more accurate than a height/weight BMR formula.
Why it matters: Your BMR is the floor of your daily calorie burn. To lose fat, you need to eat below your total daily energy expenditure (BMR + activity). To gain muscle, you need to eat slightly above. Knowing your BMR makes either goal precise instead of guesswork.
10. Body Composition Recommendations
The bottom of the sheet gives you specific weight, fat, and muscle change targets. For example: “lose 4.2 kg fat, gain 1.5 kg muscle.”
These are computed from your current state versus the InBody-recommended ideal for your height and gender. They are a useful starting goal, especially in the first few scans, but personal trainers and clinicians often refine them based on your specific situation.
How to use your InBody Result Sheet

Three rules:
- Track segmental muscle, not just total muscle. Imbalances between left and right tell you what to train next.
- Watch ECW/TBW and Visceral Fat Level. These two are the most underread health risk indicators on the sheet.
- Compare across scans, not within one scan. Direction matters more than any single number.
If you are not yet tracking your body composition with regular scans, find a verified InBody scan centre near you. Most centres in India offer a scan plus consultation for between ₹500 and ₹2,000.
Frequently asked questions
Q. How often should I get an InBody scan?
For most people, every 8 to 12 weeks is the right cadence. Athletes in training cycles may scan more frequently (every 4 weeks). Hospital patients may scan as often as their care plan requires.
Q. Can I compare my InBody result to a DEXA scan?
Yes, InBody has 98% correlation with DEXA in published validation studies. The metrics are not identical (DEXA reports bone density, InBody does not), but body fat and muscle mass values are very close.
Q. Why did my muscle mass drop after a long flight?
Likely fluid shift, not real muscle loss. Wait 24–48 hours, hydrate normally, and re-scan. The InBody is sensitive to the hydration state.
Q. Is the InBody scan safe during pregnancy?
InBody recommends not using BIA scans during pregnancy as a precaution. Consult your doctor for body composition tracking options during pregnancy.
Q. Can I track my InBody history without a printed sheet?
Yes, ask your scan centre about LookinBody Web or the InBody App, which stores your scan history in the cloud.
Find an InBody scan centre near you.
InBody India operates over 1,500 verified test centres across 100+ cities. Find your nearest centre on our scan locations page, or check our city-specific pages: Mumbai, Delhi, Bangalore, Chennai, Hyderabad.


Most trending articles
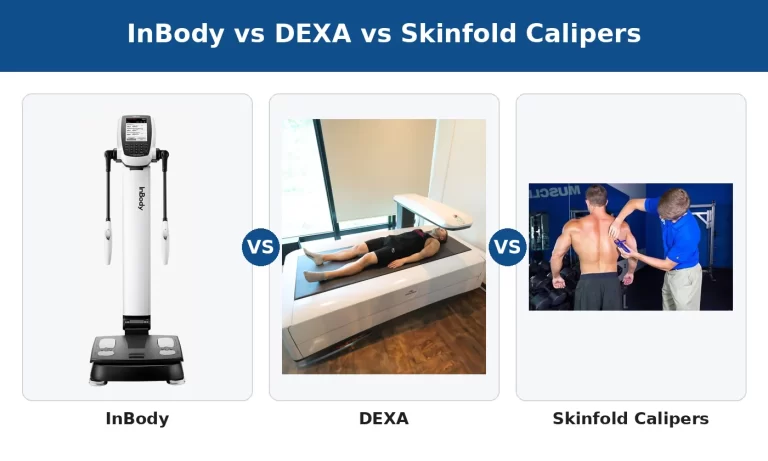
InBody vs DEXA vs Skinfold Calipers: Which Body Composition Test Is Right for You in India?
DEXA scans, InBody BIA, skinfold calipers — three different ways to measure body composition. Accuracy comparisons, cost in India, accessibility, and which method makes sense for your specific goal.

Skinny Fat in India: Why 40% of Normal Weight Indians Have Dangerously High Body Fat
India's hidden obesity epidemic. Skinny fat (TOFI — Thin Outside, Fat Inside) affects millions of normal-weight Indians. How body composition testing reveals what BMI hides — and the exact protocol to fix it.

Healthy Body Composition by Age for Indians: Reference Ranges at 20s, 30s, 40s, 50s+
Body composition reference ranges for Indian men and women by age. Find out if your body fat %, muscle mass, and visceral fat level are healthy for your age and what to do if they're not.