Body Composition 10 min read
The 9 Crucial Body Composition Secrets That Actually Predict Diabetes
Your annual blood test comes back “normal.” Your BMI is in range. Your doctor says you are fine. Yet millions of people with Type 2 diabetes and the…
Reading about body composition? Find an InBody test centre near you →
Your annual blood test comes back “normal.” Your BMI is in range. Your doctor says you are fine. Yet millions of people with Type 2 diabetes and the 96 million Americans with prediabetes were told the same thing the year before their diagnosis.
The problem is not the blood test. The problem is that standard tests measure outputs. Body composition measures the underlying architecture that drives those outputs: how much visceral fat surrounds your organs, how much skeletal muscle is available to clear glucose from your bloodstream, and where exactly fat is being stored in your body.
In this article, we break down the 9 body composition markers that clinical research links directly to diabetes risk and explain precisely how to measure each one with BIA technology in under 60 seconds.
| 537M Adults with diabetes worldwide (IDF, 2021) | 96M US adults with prediabetes | 80% Of Type 2 cases preventable with lifestyle change | 98.4% Accuracy of InBody BIA vs DEXA gold standard |
| KEY POINT: Blood tests detect diabetes after it has already developed. Body composition analysis can reveal the metabolic environment that makes diabetes likely, years before blood glucose becomes abnormal. |
Why Body Composition Is a Superior Diabetes Screening Tool
Traditional diabetes risk assessment relies on fasting glucose, HbA1c, BMI, and family history. These are valuable but incomplete. BMI, for example, cannot distinguish between muscle mass and fat mass; a highly muscular athlete and a sedentary individual with 40% body fat can share the same BMI.
Body composition analysis using Bioelectrical Impedance Analysis (BIA) disaggregates the body into its functional components: skeletal muscle mass, body fat mass, visceral fat, total body water, and segmental distributions across limbs and trunk. Each of these components carries an independent relationship with insulin sensitivity, pancreatic beta-cell function, and systemic inflammation.
Secret 1: Visceral Fat Level, The Hidden Danger Inside Your Abdomen
Visceral fat is the fat stored deep within the abdominal cavity, surrounding the liver, pancreas, and intestines. Unlike subcutaneous fat (the fat you can pinch), visceral fat is metabolically active; it continuously releases inflammatory cytokines, free fatty acids, and adipokines that directly impair insulin signalling.
A 2020 meta-analysis in Obesity Reviews found that individuals with high visceral fat had a 3.5-fold greater risk of developing Type 2 diabetes compared to those with low visceral fat, independent of total body weight.
- Safe range: Visceral Fat Level 1–9
- Elevated lifestyle intervention recommended: Visceral Fat Level 10–14
- High risk clinical evaluation advised: Visceral Fat Level 15+
InBody measures: Visceral Fat Level (1–20 scale) printed directly on your InBody result sheet. Target: Level 9 or below for optimal metabolic health.
Secret 2: Body Fat Percentage, Total Adiposity and Insulin Resistance
Total body fat percentage (PBF) reflects the proportion of your body mass that is fat tissue. Excess fat, particularly above 25% in men and 32% in women, is associated with adipose tissue dysfunction, where fat cells become enlarged, hypoxic, and inflamed, producing signals that block insulin receptors in muscle and liver cells.
The landmark PREDIMED study demonstrated that reducing total body fat percentage by just 3–5 percentage points, without significant weight loss, was sufficient to meaningfully improve insulin sensitivity in high-risk individuals.
InBody measures: Percentage Body Fat (PBF) with clinically colour-coded ranges. Requires no height-weight formula measured directly from impedance.
Secret 3: Skeletal Muscle Mass Your Body’s Primary Glucose Disposal Organ
Skeletal muscle accounts for approximately 80% of insulin-stimulated glucose uptake in the body. When you eat carbohydrates, it is your skeletal muscle, not your liver, that clears the vast majority of glucose from the bloodstream via GLUT-4 transporter activation.
Low skeletal muscle mass (sarcopenia) is now recognised as an independent risk factor for Type 2 diabetes. A 2021 study in Diabetes Care found that individuals in the lowest quartile of muscle mass index had a 70% higher odds of insulin resistance compared to those in the highest quartile.
InBody measures: Skeletal Muscle Mass (SMM) in kilograms, displayed with comparison to population norm. Segmental analysis shows if a deficit exists in the legs (the largest muscle group) specifically.

Secret 4: The Fat-to-Muscle Ratio: A Combined Risk Index
Individually, high fat and low muscle each increase diabetes risk. Together, they create a compounding effect that researchers have termed “metabolic obesity” or, in more severe cases, “sarcopenic obesity” a condition where an individual appears metabolically compromised despite having a normal or even low body weight.
The fat-to-muscle ratio (FMR) integrates both markers into a single index. A 2022 study in the Journal of Clinical Endocrinology & Metabolism found the FMR to be a stronger predictor of insulin resistance than either metric alone, outperforming BMI and waist circumference.
InBody measures: Both SMM and Body Fat Mass are printed on every result sheet, allowing immediate calculation of the fat-to-muscle ratio by any clinician or health professional.
Secret 5: Trunk Fat Mass Central Adiposity Beyond Waist Measurement
While waist circumference is a common proxy for central adiposity, it cannot distinguish between subcutaneous abdominal fat and visceral fat. InBody’s segmental analysis provides trunk fat mass as a more precise measure of the lipotoxic fat depot most closely associated with hepatic insulin resistance and ectopic fat deposition in the liver and pancreas.
Research published in Diabetologia (2019) demonstrated that trunk fat mass was more strongly correlated with fasting insulin and HOMA-IR (a validated insulin resistance score) than both total body fat and waist circumference.
InBody measures: Segmental body fat analysis separating trunk fat from arm and leg fat. Available on InBody 570 and above models.
Secret 6: Leg Muscle Mass The Forgotten Metabolic Engine
The muscles of the lower limbs, quadriceps, hamstrings, gluteals, and calves represent the largest single muscle mass in the body and are therefore the dominant site of glucose disposal. Selectively low leg muscle mass (often caused by sedentary behaviour, ageing, or poor nutrition) disproportionately impairs whole-body glucose metabolism.
A large-scale Korean cohort study (n = 15,000+) published in Medicine (2021) found that low leg muscle mass was associated with a 50% increased risk of new-onset diabetes over a 10-year follow-up period, independent of age, BMI, and abdominal obesity.
InBody measures: Segmental lean analysis for each limb right leg, left leg, right arm, left arm, and trunk. Identifies regional muscle deficits that total body measurements would miss.
Secret 7: Extracellular Water Ratio A Marker of Chronic Inflammation
In a healthy body, approximately two-thirds of total body water is intracellular (inside cells), and one-third is extracellular (in blood plasma and interstitial fluid). A shift in this ratio, known as an elevated ECW/TBW (extracellular water to total body water) ratio, is a validated biomarker of chronic systemic inflammation and cellular dysfunction.
Chronic low-grade inflammation is now established as a core mechanism in the progression from insulin resistance to overt Type 2 diabetes. An elevated ECW ratio detects this inflammatory state before it manifests in conventional blood markers.
InBody measures: ECW/TBW ratio with clinical reference range. A value > 0.390 is considered elevated. This marker is not available from any scale-based measurement.
| CLINICAL NOTE: The ECW/TBW ratio requires multi-frequency BIA to measure accurately. InBody uses 6 frequencies (1, 5, 50, 250, 500, 1000 kHz) to separate intra- and extracellular water compartments with precision. Single-frequency bioimpedance devices cannot provide this measurement. |
Secret 8: Body Fat Distribution (Android vs Gynoid) Where Fat Lives Matters
“Android” fat distribution fat concentrated in the upper body and abdomen, is strongly associated with metabolic risk, insulin resistance, and cardiovascular disease. A “Gynoid” fat distribution, concentrated in the hips and thighs, is comparatively protective. Two individuals with identical body fat percentages can have profoundly different diabetes risk depending purely on where their fat is distributed.
The android-to-gynoid fat ratio has been shown in multiple prospective studies to predict new-onset diabetes with an accuracy comparable to fasting glucose, particularly in individuals with normal BMI who would otherwise escape standard screening.
InBody measures: Android and gynoid fat mass are available on InBody 770 and 970 models, providing the A/G ratio directly on the result sheet.
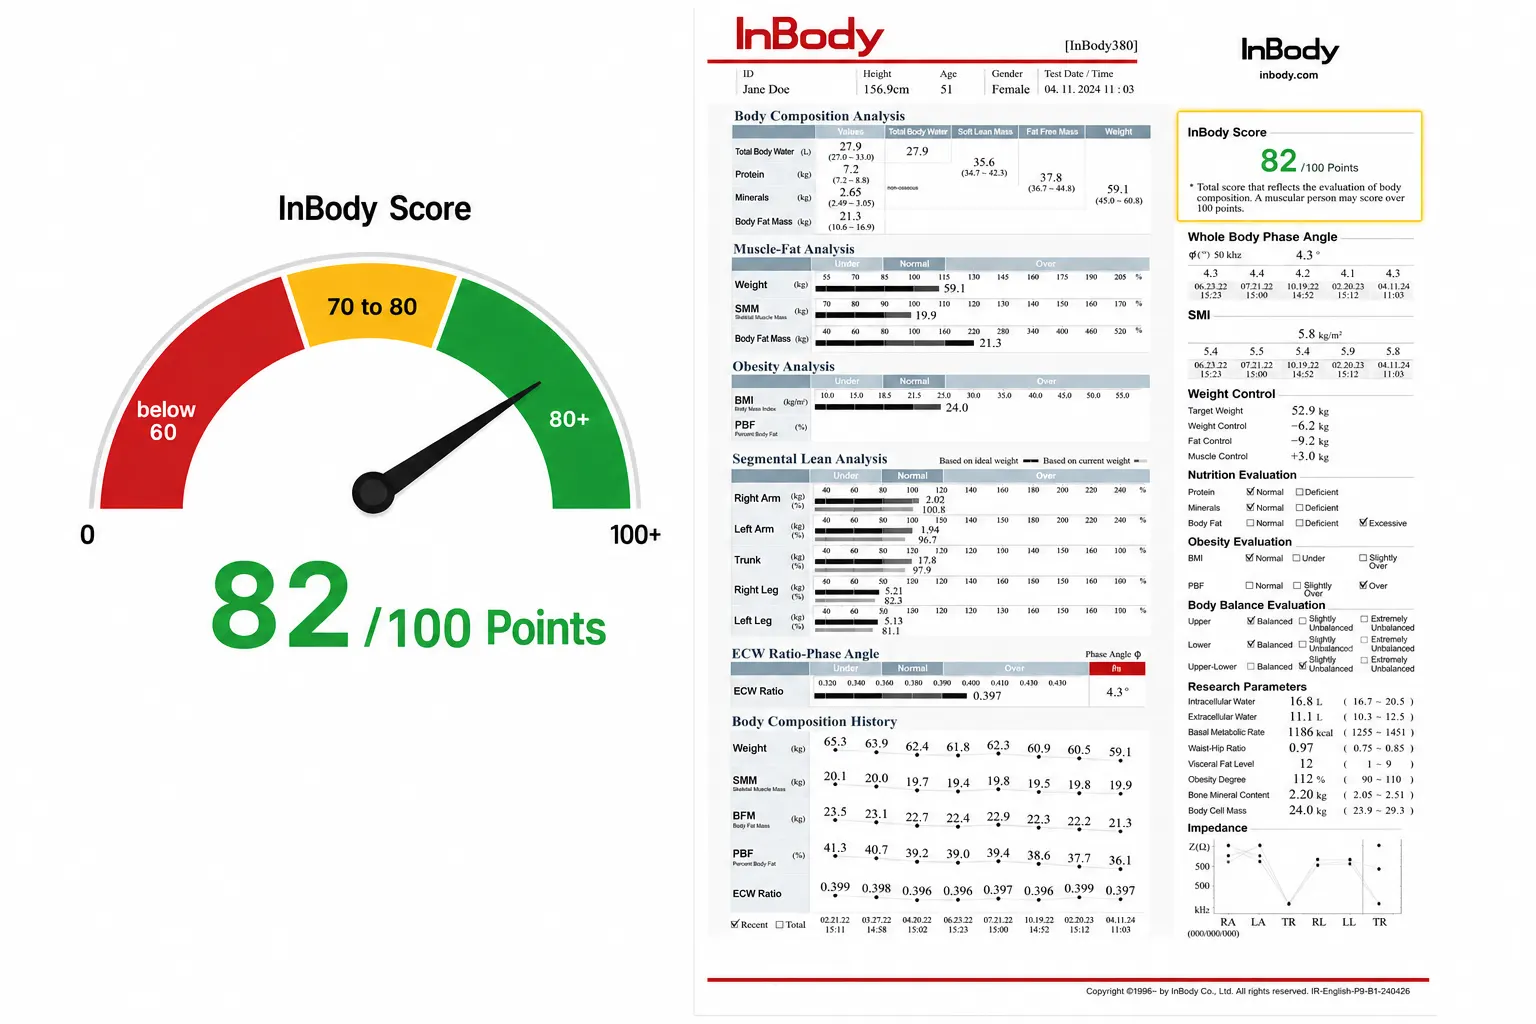
Secret 9: InBody Score Your Composite Metabolic Health Index
Rather than evaluating each marker in isolation, the InBody Score provides a single composite index (0–100) that reflects the overall balance between muscle mass and body fat relative to an age- and gender-matched reference population. It functions as an integrated metabolic health indicator.
A score below 70 has been associated in clinical literature with increased odds of metabolic syndrome components, including central obesity, dyslipidaemia, hypertension, and impaired fasting glucose, the precursor conditions to Type 2 diabetes. A score of 80 or above is associated with a significantly lower cardiometabolic risk profile.
InBody measures: InBody Score is automatically calculated and printed on every result sheet. It provides a single actionable number for patients and clinicians to track over time.
Body Composition vs Standard Tests: A Clinical Comparison
| Metric | Standard Blood Test / BMI | InBody Body Composition |
| Visceral fat | ❌ Not measured | ✅ Direct segmental measurement |
| Skeletal muscle mass | ❌ Not measured | ✅ kg + population comparison |
| Fat distribution (trunk) | ❌ Not available | ✅ Segmental analysis |
| ECW/TBW (inflammation) | ❌ Requires specialist test | ✅ Printed on result sheet |
| Android/gynoid ratio | ❌ Not available | ✅ InBody 770/970 models |
| Identifies sarcopenic obesity | ❌ Normal BMI masks this | ✅ Detected in 60 seconds |
| Time required | 24–72 hours (lab processing) | ✅ Under 60 seconds |
| Radiation | DEXA: ionising radiation | ✅ Non-surgical, non-invasive |
| Cost | Multiple tests + specialist ref. | ✅ Single scan |
Who Should Prioritise a Body Composition Analysis for Diabetes Risk?
Clinical guidelines from the American Diabetes Association (ADA) and the International Diabetes Federation (IDF) recommend annual diabetes screening for high-risk groups. Body composition analysis adds a precision layer to this screening. Consider testing if you:
- Have a family history of Type 2 diabetes
- Are over 45 years of age
- Have been told your BMI is in the “healthy” range but carry noticeable abdominal fat
- Are sedentary for more than 8 hours per day
- Have had gestational diabetes or given birth to a baby weighing over 4 kg, or have polycystic ovary syndrome (PCOS)
- Have prediabetes (fasting glucose 100–125 mg/dL or HbA1c 5.7–6.4%)
- Are an athlete or highly muscular individual (BMI may overstate your risk)
| MEDICAL DISCLAIMER: Body composition analysis is a screening and monitoring tool, not a diagnostic test. Always consult a qualified healthcare provider to interpret results and discuss your personal risk factors. InBody scans should complement, not replace, clinical evaluation. |
Frequently Asked Questions
Q: Can body composition analysis diagnose diabetes?
A: No. Body composition analysis is a risk assessment and monitoring tool. It identifies metabolic risk markers such as visceral fat and low muscle mass that are associated with diabetes risk. Diagnosis of diabetes requires blood glucose or HbA1c testing by a qualified clinician.
Q: How accurate is BIA for measuring body composition?
A: InBody’s multi-frequency BIA technology has been validated against DEXA, the gold standard, achieving 98.4% accuracy. Crucially, InBody uses only direct impedance measurements with no empirical estimations based on age or gender, which significantly improves precision.
Q: How often should I get an InBody scan if I am at risk of diabetes?
A: For individuals with prediabetes or multiple risk factors, quarterly scans are recommended to track changes in visceral fat, muscle mass, and ECW ratio in response to dietary and exercise interventions. Monitoring frequency should be guided by your healthcare provider.
Q: Is InBody scanning safe for people with diabetes?
A: Yes. InBody BIA is safe for most individuals, including those with diabetes. However, individuals with implanted pacemakers or defibrillators should not undergo BIA testing. Pregnant women should consult their physician before scanning.
Q: What is a good InBody score for diabetes prevention?
A: An InBody Score of 80 or above is associated with a favourable metabolic profile and lower cardiometabolic risk. Scores below 70 warrant a detailed review of body composition markers with a healthcare provider.
Key Takeaways
- Blood tests detect diabetes after it has developed. Body composition reveals the risk years earlier.
- Visceral fat, skeletal muscle mass, body fat distribution, and the ECW ratio are the 4 most clinically significant composition markers for diabetes risk.
- Sarcopenic obesity: high fat, low muscle is invisible to BMI but fully visible on an InBody scan.
- InBody’s BIA technology measures all 9 markers in under 60 seconds at 98.4% accuracy versus DEXA.
- Regular body composition monitoring, especially for visceral fat and leg muscle mass, is a proactive, evidence-based approach to diabetes prevention.
| Know Your Numbers. Protect Your Health. Get a complete body composition analysis, including visceral fat, muscle mass, and metabolic risk markers in under 60 seconds with an InBody scan. |

Find an InBody Scanner Near You
References & Further Reading
1. International Diabetes Federation. IDF Diabetes Atlas, 10th edition. Brussels: IDF, 2021.
9. American Diabetes Association. “Standards of Medical Care in Diabetes — 2024.” Diabetes Care. 2024.

Most trending articles

InBody vs DEXA vs Skinfold Calipers: Which Body Composition Test Is Right for You in India?
DEXA scans, InBody BIA, skinfold calipers — three different ways to measure body composition. Accuracy comparisons, cost in India, accessibility, and which method makes sense for your specific goal.

Skinny Fat in India: Why 40% of Normal Weight Indians Have Dangerously High Body Fat
India's hidden obesity epidemic. Skinny fat (TOFI — Thin Outside, Fat Inside) affects millions of normal-weight Indians. How body composition testing reveals what BMI hides — and the exact protocol to fix it.

Healthy Body Composition by Age for Indians: Reference Ranges at 20s, 30s, 40s, 50s+
Body composition reference ranges for Indian men and women by age. Find out if your body fat %, muscle mass, and visceral fat level are healthy for your age and what to do if they're not.