Body Composition 13 min read
If You’re Losing Weight, Are You Losing the Right Weight?
Weight loss is not always a health improvement. Losing the wrong kind of weight, muscle instead of fat, can silently worsen your metabolism, increase disease risk, and set…
Reading about body composition? Find an InBody test centre near you →
Weight loss is not always a health improvement. Losing the wrong kind of weight, muscle instead of fat, can silently worsen your metabolism, increase disease risk, and set you up for faster fat regain. Here is how to know which one is happening.
Congratulations, you are losing weight. But before you celebrate, there is one question your doctor should be asking and almost certainly is not: Are you losing fat, or are you losing muscle? These two outcomes look identical on a scale, yet they produce opposite effects on your health. One is a genuine improvement. The other is a slow metabolic setback in disguise.
Not all weight loss is created equal
When people say they want to “lose weight,” what they really mean, whether they know it or not, is that they want to lose body fat. Specifically, they want to reduce the fat that accumulates around organs, under the skin, and throughout the body, raising the risk of diabetes, heart disease, joint pain, and dozens of other conditions.
But the human body does not lose fat in isolation. When you create a caloric deficit, whether through diet, exercise, medication, or surgery, your body loses a mixture of tissue types. The proportion of fat versus muscle in that mixture depends entirely on how you are losing weight.
This is the question no weighing scale can answer. And it is the most important question in weight management.
The Essential Distinction
“Losing weight and losing fat are not the same thing. You can lose weight while becoming metabolically sicker. You can also gain weight while becoming metabolically healthier. The scale cannot tell you which is happening, but InBody can.”
| 3 types of weight you can lose: fat, muscle, water. Only one is the goal. | 25–40% Of total weight lost on aggressive restriction may be lean muscle mass | 72% Of dieters regain all lost weight, partly because muscle loss slows metabolism |
The four types of weight loss form a quality spectrum
Not all weight loss is equal. Think of weight loss as existing on a quality spectrum from genuinely health-improving at one end to actively harmful at the other.
Weight Loss Quality Spectrum: What InBody Reveals
- Fat loss only ~ Ideal
- Fat loss + muscle gain ~ Best possible
- Fat + some muscle loss ~ Acceptable
- Mostly muscle loss ~ Harmful
Type 1 :Fat loss only (the ideal)
The body is drawing energy from fat stores while preserving all lean tissue. Resting metabolic rate stays stable, insulin sensitivity improves, visceral fat reduces, and cardiovascular risk markers improve. This is the goal of every weight management programme, but achieving it requires the right protein intake, the right exercise approach, and the right rate of loss.
Type 2: Body recomposition (the best possible)
The body is simultaneously reducing fat mass and building muscle, often on a near-maintenance calorie intake with high protein and progressive resistance training. The scale may show little or no change for weeks while body composition dramatically improves. This is the most health-promoting outcome and the most invisible to a weighing scale.
Type 3: Mixed fat and muscle loss (acceptable but suboptimal)
The most common pattern in conventional weight loss programmes. Some fat is lost alongside some lean mass. The proportion matters enormously; losing 80% fat and 20% muscle is very different from losing 60% fat and 40% muscle. Without body composition monitoring, you cannot know which ratio you are achieving.
Type 4: Predominantly muscle loss (harmful)
The worst-case outcome common in crash diets, extreme caloric restriction, and weight loss without resistance training. The scale shows reassuring progress while the body is quietly dismantling its metabolic engine. Resting metabolic rate drops, insulin resistance worsens, and the stage is set for rapid fat regain as soon as normal eating resumes.
Type 4 is more common than most patients realise
Research shows that on aggressive caloric restriction without resistance training, 25–40% of total weight lost may come from lean tissue. On very low-calorie diets (below 800 kcal/day), this proportion can exceed 50%. Every single one of these patients sees a falling number on their scale and believes they are succeeding.
Why “rapid” weight loss is often the most dangerous kind
Speed is the enemy of quality when it comes to weight loss. The faster the weight is lost, the higher the proportion of weight loss comes from lean tissue rather than fat stores. This is not a matter of willpower or effort; it is basic physiology.
- The body’s energy hierarchy during a deficit: Your body always burns a mix of fat and carbohydrate for fuel. When calories drop dramatically, glycogen (stored glucose) depletes first, causing rapid early weight loss that is mostly water and glycogen, not fat. After glycogen is depleted, the body increases fat oxidation and begins to break down muscle protein for gluconeogenesis (glucose production). The more severe the deficit, the more muscle is sacrificed.
- The adaptive thermogenesis trap: As weight is lost rapidly, the body activates adaptive thermogenesis, reducing resting metabolic rate beyond what would be predicted from the reduced body mass alone. Research shows this metabolic suppression can persist for years after weight loss, explaining why most dieters regain weight even when eating the same calories that previously caused loss. Muscle loss amplifies this effect because muscle tissue is what drives BMR.
- The fat regain cycle: Lost muscle = lower BMR = fewer calories burned at rest = easier fat storage. When normal eating resumes after a crash diet, the body regains fat faster and in greater quantity because its metabolic rate has been permanently lowered by the muscle loss. This is why 72% of dieters regain all lost weight within 5 years, and many end up heavier than before, with worse body composition than when they started.
The Indian context is why this matters more here
Indian populations already have lower baseline skeletal muscle mass relative to body weight compared to Western populations. This means the metabolic consequences of muscle loss are amplified, and the threshold for sarcopenic obesity is reached faster. Rapid weight loss programmes that might produce only moderate muscle loss in a Western patient can push an Indian patient into clinically significant sarcopenia.
How to recognise if you are losing the wrong weight
Your body sends signals when the quality of weight loss is poor. Learn to recognise them and know that the only way to confirm them objectively is through body composition analysis.
Warning Signs vs Positive Signs During Weight Loss
- Weight dropping faster than 1 kg per week, lean mass loss is likely.
- Increasing fatigue and weakness despite scale progress
- Looking “flatter” or less toned despite lower body weight
- Persistent hunger even when eating at the target calories
- Falling BMR on serial InBody scans is direct evidence of lean mass loss.
- Declining phase angle on InBody cellular muscle quality deteriorating.
- Stable or increasing SMM on InBody while body fat is falling
- BMR staying stable or improving during the weight loss programme
- Visceral fat level falling on serial InBody scans.
- Improved strength and physical performance alongside weight loss
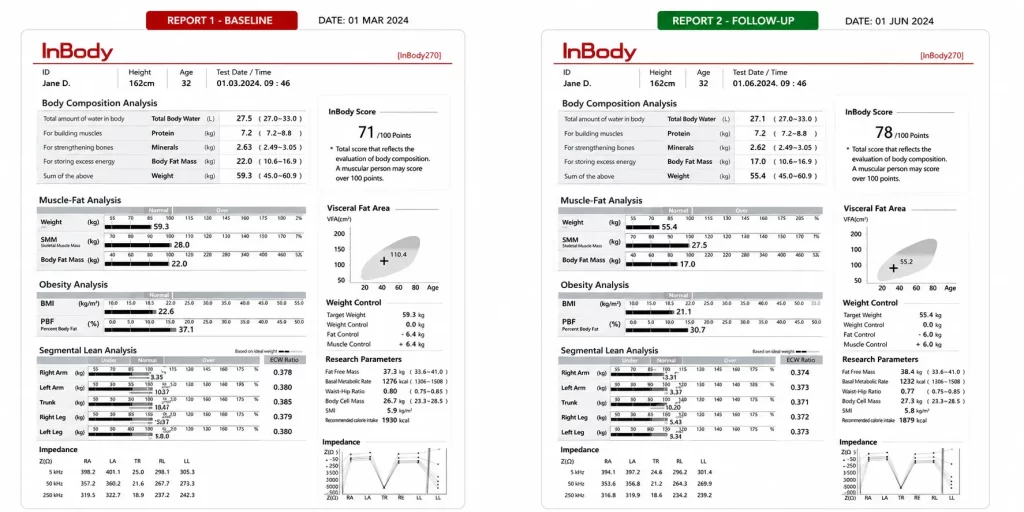
What InBody measures to confirm quality weight loss
A standard InBody scan takes under 60 seconds and produces the four measurements that together answer the quality weight loss question definitively at every stage of your programme.
- Skeletal Muscle Mass (SMM): Is muscle being preserved? The single most important quality indicator of declining SMM means wrong-weight loss regardless of scale progress.
- Body Fat Mass (BFM): Is fat actually being lost? Confirms whether the scale reduction is genuine fat reduction or a mix of tissue losses, including lean mass.
- Visceral Fat Level: Is it dangerous organ fat? Visceral fat reduction is the highest-value metabolic outcome of any weight loss programme, and only InBody can confirm it.
- Basal Metabolic Rate (BMR): Is metabolism being maintained? A stable or rising BMR during weight loss confirms lean mass is being preserved and the metabolic engine is intact.
The monitoring timeline that catches problems early
| Timepoint | What to Measure | What to Look For | Action if Concerning |
|---|---|---|---|
| Baseline (Day 1) | Full InBody scan SMM, BFM, VFL, BMR, Phase Angle | Establish true starting composition | Set individualised targets based on actual body composition |
| Week 4–6 | Full InBody scan | Is BFM falling? Is SMM stable? Is BMR stable? | If SMM declining → increase protein + add resistance training immediately |
| Week 12 | Full InBody scan + functional assessment | Net fat lost vs muscle lost quality ratio | If fat:muscle ratio below 3:1, revise approach deficit may be too aggressive |
| Week 24 | Full InBody scan + outcome review | VFL reduction, BMR trend, Phase Angle | Assess whether maintenance phase or continued intervention is appropriate |
The protocol for losing the right weight

Quality weight loss, losing predominantly fat while preserving or building muscle, is not accidental. It requires three simultaneous pillars working together. Remove any one of them and the quality of weight loss drops significantly.
- Adequate protein 1.4 to 2.0 g per kg of ideal body weight daily: Protein is the raw material for muscle protein synthesis, the process that builds and maintains muscle tissue. During a caloric deficit, protein requirements actually increase because the body is under greater catabolic pressure. Spread intake across 3–4 meals throughout the day. For a 65 kg person, this means approximately 90–130 g of protein daily, significantly more than the average Indian diet provides.
- Progressive resistance training, minimum 3 sessions per week: Resistance exercise is the only reliable anabolic signal that tells your body to preserve and build muscle even in a caloric deficit. Targeting all major muscle groups with progressive overload, gradually increasing weight or repetitions, is essential. Cardio may be added for cardiovascular health, but it cannot replace resistance training for muscle preservation. This is non-negotiable for quality fat loss.
- Moderate, sustainable caloric deficit 300 to 500 kcal below maintenance: This produces gradual weight loss of 0.5–1 kg per week, the rate that consistently preserves the most lean tissue while achieving meaningful fat reduction. More aggressive deficits produce faster scale results but disproportionate muscle loss. The goal is fat loss, not simply scale reduction, and the rate of loss is one of the most controllable determinants of outcome quality.
- Body composition monitoring every 4–6 weeks: InBody scans at baseline and every 4–6 weeks provide the only objective confirmation that fat is being lost and muscle is being preserved. If data shows SMM declining, the protocol must be adjusted immediately before the metabolic consequences accumulate into something clinically significant. Without this monitoring, you are flying blind, regardless of how many kilograms the scale has moved.
Why are some patients losing weight and getting worse?
Some patients come to the clinic with falling scale numbers, improving HbA1c from reduced caloric intake, and a genuine belief that their health is improving. Then an InBody scan reveals the truth: Skeletal muscle mass has dropped significantly, BMR is suppressed, and visceral fat has barely moved despite total weight loss.
This is not uncommon. It is the clinical cost of relying on the scale alone.
- GLP-1 therapy patients face amplified risk:
Patients on semaglutide (Obeda, Ozempic) or other GLP-1 receptor agonists experience powerful appetite suppression that drives large caloric deficits. Without concurrent resistance training and adequate protein, a significant proportion of that weight loss will come from lean mass. The drugs are powerful, but they have no mechanism to selectively preserve muscle. Body composition monitoring is essential for every patient on pharmacotherapy-driven weight loss. - Why patients abandon effective programmes:
A patient doing everything right, high protein, resistance training, moderate deficit, may show no scale change for 4–6 weeks during body recomposition as fat loss is offset by muscle gain. Without InBody data showing the real improvement, this patient concludes the programme is not working and stops. Body composition monitoring is not just clinical; it is the motivational anchor that keeps patients compliant with the approaches that actually work.
Frequently asked questions
Q. How do I know if I am losing fat or muscle?
The only reliable way to know is through body composition analysis, such as an InBody scan. Physical signs can hint at muscle loss, increasing fatigue, weakness, or looking “flatter” despite scale progress, but these are unreliable indicators. An InBody scan directly measures skeletal muscle mass, body fat mass, and BMR, giving you objective data on whether each kilogram of scale reduction is coming from fat, muscle, or both.
Q. What is a healthy rate of weight loss?
Evidence supports 0.5–1 kg per week as the rate of loss that best preserves lean muscle mass while achieving meaningful fat reduction. More aggressive rates, 1.5–2+ kg per week, are associated with significantly higher lean mass loss. The initial weeks of any diet often show faster scale reductions due to water and glycogen loss rather than true fat reduction, which can create misleading impressions of progress.
Q. Can I lose fat without losing any muscle at all?
Yes, with the right approach. A moderate caloric deficit (300–500 kcal/day), high protein intake (1.4–2.0 g/kg/day), and progressive resistance training can preserve essentially all lean mass during fat loss. For beginners to resistance training, the anabolic stimulus of new exercise can even cause simultaneous fat loss and muscle gain (body recomposition). Serial InBody scans confirm when this ideal outcome is being achieved.
Q. Does losing muscle make it harder to lose weight in future?
Yes significantly. Skeletal muscle is a metabolically active tissue that burns calories at rest. Each kilogram of muscle lost reduces your resting metabolic rate by approximately 13 kcal/day. Over time, cumulative muscle loss from repeated dieting creates an increasingly suppressed BMR, requiring progressively lower caloric intake to maintain weight. This is the physiological basis of the “yo-yo dieting” pattern that leaves people heavier after every cycle.
Q. How often should I get an InBody scan during a weight loss programme?
At minimum: A baseline scan before starting, a check at 4–6 weeks, a review at 12 weeks, and a comprehensive outcome assessment at 6 months. For patients on pharmacotherapy (GLP-1 drugs, etc.) or aggressive caloric restriction, monthly scans during active treatment allow earlier identification of lean mass loss and timely adjustment of protein intake and exercise prescription before clinical consequences accumulate.
Key takeaways
- Weight loss and fat loss are not the same: Every kilogram of weight lost is a mixture of fat, muscle, and water. The proportion determines whether your health is improving or silently worsening. The scale cannot tell you what only body composition analysis can.
- Rapid weight loss often means wrong weight loss: Crash diets and aggressive restriction drive disproportionate muscle loss. On very low-calorie diets, more than half of the weight lost may be lean mass, a metabolic setback that raises disease risk and guarantees fat regain.
- Three pillars ensure quality weight loss: Adequate protein (1.4–2.0 g/kg/day), progressive resistance training (3+ sessions/week), and a moderate caloric deficit (0.5–1 kg/week loss) together protect lean mass while maximising fat reduction.
- Body recomposition is invisible on a scale: The best possible outcome, simultaneous fat loss and muscle gain, shows zero change on the scale for weeks. InBody scans reveal this success; without them, patients abandon effective programmes, thinking nothing is working.
- InBody monitoring turns guesswork into data: Baseline and serial InBody scans at 4–6 week intervals provide the objective confirmation that fat is being lost and muscle is being preserved, the only data that truly answers whether a weight loss programme is working in the right direction.
Know exactly what your patients are losing
InBody body composition analysis answers the question every weight loss patient deserves to have answered: Am I losing the right weight? Give your clinic the tool to answer it in under 60 seconds.

Find an InBody Scanner Near You
Medical Disclaimer: This article is for informational and educational purposes only. It does not constitute medical advice, diagnosis, or treatment recommendations. All clinical decisions should be made by qualified healthcare providers based on individual patient assessment. InBody results should be interpreted in conjunction with full clinical evaluation.
References & further reading
- Cava E, et al. — Preserving Healthy Muscle during Weight Loss. Advances in Nutrition, 2017;8(3):511–519.
- Fothergill E, et al. — Persistent metabolic adaptation 6 years after The Biggest Loser competition. Obesity, 2016;24(8):1612–1619.
- Stokes T, et al. — Recent Perspectives on Dietary Protein for Muscle Hypertrophy. Nutrients, 2018;10(2):180.
- Wilding JPH, et al. — Once-Weekly Semaglutide in Adults with Overweight or Obesity. NEJM, 2021;384:989–1002.
- Yajnik CS, Yudkin JS — The Y-Y Paradox: The Thin-Fat Indian. Lancet, 2004;363(9403):163.
- Kalra S, et al. — Indian Consensus on Sarcopenia including T2DM Sarcopenic Obesity. Int J Gen Med. 2025;18:1731–1745.
- Hall KD, et al. — Quantification of the effect of energy imbalance on bodyweight. Lancet, 2011;378(9793):826–837.
- InBody — Body Composition Analysis in Metabolic Disease Management. Clinical White Paper, 2024.

Most trending articles

InBody vs DEXA vs Skinfold Calipers: Which Body Composition Test Is Right for You in India?
DEXA scans, InBody BIA, skinfold calipers — three different ways to measure body composition. Accuracy comparisons, cost in India, accessibility, and which method makes sense for your specific goal.

Skinny Fat in India: Why 40% of Normal Weight Indians Have Dangerously High Body Fat
India's hidden obesity epidemic. Skinny fat (TOFI — Thin Outside, Fat Inside) affects millions of normal-weight Indians. How body composition testing reveals what BMI hides — and the exact protocol to fix it.

Healthy Body Composition by Age for Indians: Reference Ranges at 20s, 30s, 40s, 50s+
Body composition reference ranges for Indian men and women by age. Find out if your body fat %, muscle mass, and visceral fat level are healthy for your age and what to do if they're not.