Body Composition 16 min read
Diabetes Reversal: Is It Possible? The Evidence-Based Plan
India has 101 million people living with type 2 diabetes, the highest absolute number in the world. Most of them are monitored with HbA1c, fasting glucose, and body…
Reading about body composition? Find an InBody test centre near you →
India has 101 million people living with type 2 diabetes, the highest absolute number in the world. Most of them are monitored with HbA1c, fasting glucose, and body weight. These tools tell you where blood sugar has been. They don’t explain why it got there, and they cannot tell you what to change to make it better. The result is a diabetes management approach that treats a body-composition disease using metabolic markers that measure its consequences rather than its causes.
The science of body composition in diabetes has advanced dramatically in the last decade. We now know that skeletal muscle mass handles approximately 80% of insulin-stimulated glucose uptake, and that visceral fat drives insulin resistance, beta-cell failure, and cardiovascular complications simultaneously. Also, we know that BMI classifies 71.5% fewer diabetic patients as obese than body fat percentage does. And we know that InBody body composition technology can measure all of this in under 60 seconds. In this article, we reveal the 7 most important body composition secrets that transform diabetes management and explain exactly how to apply each one.
| 101M Indians living with type 2 diabetes the highest absolute burden globally (IDF Atlas 2023) | 80% Of insulin-stimulated glucose uptake handled by skeletal muscle the primary target for diabetes reversal | 71.5% T2DM patients classified as obese by body fat % vs only 32.4% by BMI (InBody 770, PMC 2021, n=2,404) | 4× Higher odds of T2DM per kg increase in visceral fat mass in women (Scientific Reports 2019 meta-analysis) |
Why HbA1c and BMI Are Not Enough
HbA1c measures the average blood glucose over approximately three months. It is an essential tool for monitoring glycaemic control. But it tells you nothing about why blood glucose is elevated. Is it because visceral fat is driving insulin resistance? Or is it because skeletal muscle mass has declined and glucose disposal capacity is reduced? Is it because intramyocellular lipid accumulation is impairing insulin signalling at the cellular level? HbA1c cannot distinguish between these causes. Body composition analysis can.
BMI compounds the problem. A PMC retrospective chart review of 2,404 T2DM patients using InBody 770 confirmed that 71.5% of patients were obese by body fat percentage, yet only 32.4% met the BMI threshold for obesity. The other 39.1% classified as normal or overweight by BMI carried clinically significant excess adiposity that their BMI did not detect. Their diabetes was being managed without awareness of the body composition problem driving it.
THE INDIAN METABOLIC BLIND SPOT
Indian patients develop type 2 diabetes at BMI levels that Western guidelines classify as healthy. The thin-fat Indian phenotype, high body fat and visceral fat at normal or near-normal BMI, means that metabolic risk is systematically underestimated in exactly the patients who need intervention most. For every Indian diabetic patient you are managing with HbA1c and body weight alone, you are missing the body composition picture that explains why their glucose control is what it is. Learn more about why BMI misses what body composition reveals.
Secret 1: Visceral Fat, Not Total Weight, Is the Real Driver of Insulin Resistance
Visceral fat is not metabolically inert. It is an active endocrine organ that releases inflammatory cytokines TNF-α and IL-6 and free fatty acids directly into the portal circulation. These molecules impair insulin signalling at the cellular level in skeletal muscle, liver, and adipose tissue simultaneously. They also reduce adiponectin, a hormone with antiglycaemic, anti-inflammatory, and cardioprotective properties, creating a cascade of metabolic deterioration that accelerates both insulin resistance and beta-cell failure.
A Scientific Reports 2019 meta-analysis of DEXA studies confirmed that every 1 kg increase in visceral fat mass increases the odds of T2DM by 2.28 times in males and 4.24 times in females. This is a dose-response relationship, not a threshold effect. Every unit of visceral fat matters. And it is entirely invisible to BMI and body weight measurement.
CLINICAL IMPLICATION
For every T2DM patient presenting with poor glycaemic control, measure their visceral fat level with InBody before adjusting their pharmacological regimen. A Visceral Fat Level (VFL) of 10 or above at normal BMI is common in Indian diabetic patients and represents an independent metabolic risk that pharmacotherapy alone, without body composition intervention, cannot fully address. You cannot target what you cannot measure.
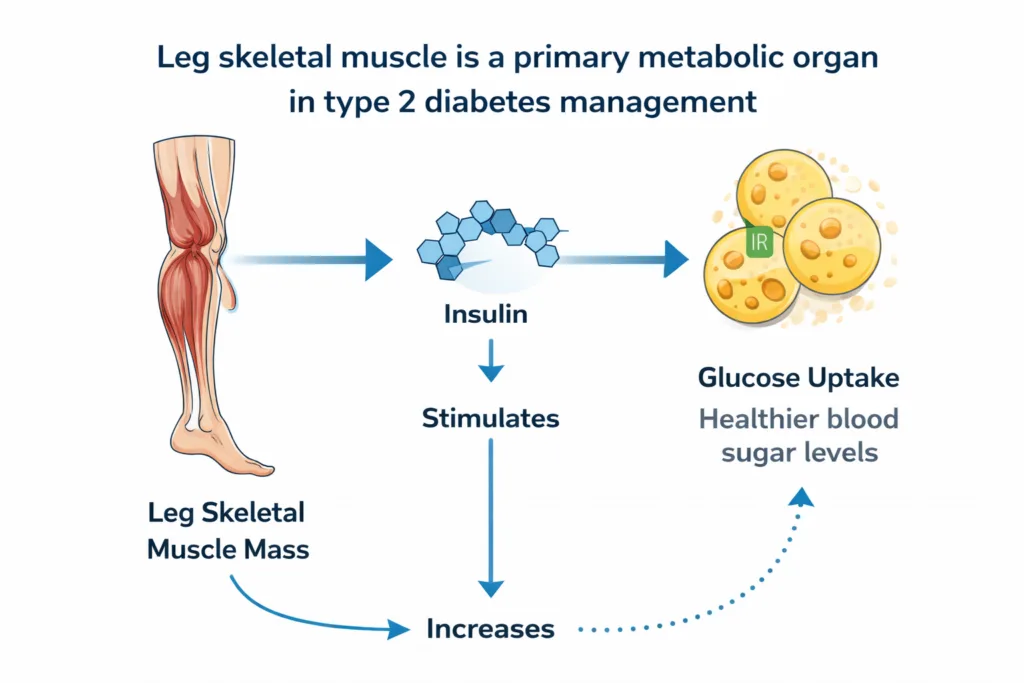
Secret 2: Your Patient’s Legs Are the Most Important Metabolic Organ in Diabetes
Skeletal muscle handles approximately 80% of insulin-stimulated glucose uptake. The legs alone account for approximately 60% of total skeletal muscle mass, making leg muscle the single most important metabolic tissue for blood glucose regulation in the body. Low leg lean mass is independently associated with increased insulin resistance, poor glycaemic control, and higher HbA1c.
This is why resistance training, particularly lower-body resistance exercise, produces the most dramatic improvements in insulin sensitivity and glycaemic control of any non-pharmacological intervention. The mechanism is direct: building leg muscle mass increases the body’s glucose disposal capacity, reducing post-prandial glucose excursions and improving HbA1c independent of any change in dietary intake.
KEY INSIGHT
InBody’s segmental lean analysis measures the lean mass of each limb independently: right arm, left arm, trunk, right leg, and left leg. This allows clinicians to identify leg muscle deficit, specifically the most clinically relevant finding for a T2DM patient, rather than relying on total muscle mass averages that can obscure localised deficits. A patient with adequate total muscle mass but below-norm leg lean mass carries significant, undetected glucose disposal impairment.
Secret 3: Diabetes Causes Sarcopenia. And Sarcopenia Makes Diabetes Worse
The relationship between T2DM and sarcopenia is bidirectional and self-reinforcing. Diabetes drives muscle loss through three concurrent mechanisms: hyperglycaemia impairs glucose uptake into muscle cells, reducing the substrate available for muscle protein synthesis. Chronic low-grade inflammation from visceral fat drives inflammatory myopathy. Reduced physical activity consequent to fatigue and neuropathy further accelerates sarcopenic progression.
Simultaneously, sarcopenia makes diabetes worse. As skeletal muscle mass declines, glucose disposal capacity falls. The body compensates with higher insulin secretion. This accelerates beta-cell exhaustion. HbA1c rises. Medication doses increase. The disease progresses not primarily because of dietary non-compliance, but because the metabolic machinery for glucose disposal is being lost, undetected, in every diabetic patient who is not having their muscle mass measured.
A PMC chart review study of 2,404 T2DM patients using InBody 770 confirmed that the prevalence of low muscle mass was 28% and sarcopenic obesity was 18.7% in the diabetic cohort, both increasing significantly with age and disease duration. These patients are not being identified by HbA1c or BMI. They are progressing undetected.
THE SARCOPENIC DIABETES TRAP
A T2DM patient who loses 2 kg of skeletal muscle over 12 months will require higher medication doses to maintain the same HbA1c, not because their adherence has worsened, but because their glucose disposal capacity has declined. Without serial InBody skeletal muscle mass measurement, this muscle loss is invisible, and the correct clinical response (resistance training + protein optimisation) is never prescribed because the problem is never detected.
Secret 4: BMI Misclassifies the Majority of Diabetic Patients. Body Fat Percentage Does Not
The InBody 770 chart review study of 2,404 T2DM patients provides the most compelling evidence on this point. When obesity was defined by body fat percentage, the clinically accurate measure 71.5% of patients were obese. When obesity was defined by BMI, the clinical standard, only 32.4% were obese. The discrepancy is 39.1 percentage points: over a third of T2DM patients are obese by composition but appear normal or merely overweight by BMI.
This has direct consequences for clinical decision-making. Patients classified as normal weight by BMI but obese by body fat percentage are less likely to be counselled on weight loss, less likely to be referred to dietitians, and less likely to have their lipid and cardiovascular risk profiles taken seriously. They are undertreated not because of clinician neglect, but because the screening tool in use is systematically misclassifying them.
EVIDENCE
The same chart review study confirmed that the InBody 770 multi-frequency BIA used in T2DM outpatient settings was a “universal, convenient, instantaneous, non-invasive, and highly accurate” body composition assessment tool. For Indian diabetic patients specifically, IAP-adjusted body fat percentage reference values that use lower cut-offs than Western standards should be applied to ensure that the thin-fat phenotype is correctly identified.
Secret 5: ECW/TBW Ratio Detects Diabetic Complications Before Blood Tests Do
The ECW/TBW ratio, extracellular water to total body water, is one of InBody’s most clinically valuable markers for diabetic patients. A normal ECW/TBW ratio is below 0.380. A rising ratio indicates chronic low-grade inflammation, fluid redistribution, or early organ dysfunction. In diabetic patients, a rising ECW/TBW ratio can detect the onset of diabetic kidney disease, the most common microvascular complication of T2DM, before eGFR begins to decline or serum creatinine rises.
Systemic inflammation caused by visceral fat and the inflammatory cytokines it secretes directly increases fluid retention and shifts body water from the intracellular to the extracellular compartment. This shift is measurable with InBody BIA. In clinical practice, a T2DM patient whose ECW/TBW ratio is trending upward over serial measurements, even within the normal range, warrants investigation for early nephropathy, cardiovascular inflammation, and protein-energy wasting, before conventional blood markers flag the problem.
KEY INSIGHT
InBody’s ECW/TBW ratio is recommended in the Indian Consensus on Sarcopenia (2025) and KDOQI guidelines for CKD monitoring in T2DM patients. For endocrinologists and diabetologists, it provides a non-invasive, point-of-care early warning for renal and cardiovascular complications at every clinic visit without waiting for uACR or eGFR results. A rising ECW/TBW trend in a T2DM patient should prompt immediate screening for nephropathy.
Secret 6: Body Composition Data Makes SGLT-2 Inhibitors and GLP-1 Agonists Work Harder
SGLT-2 inhibitors and GLP-1 receptor agonists are the most significant pharmacological advances in diabetes treatment in a generation. SGLT-2 inhibitors produce cardiovascular and renal benefits independent of glycaemic control. GLP-1 receptor agonists drive weight loss alongside glucose reduction. But their full potential is only realised when used alongside body composition monitoring.
SGLT-2 inhibitors can cause both fat loss and lean mass loss. Without serial body composition measurement, clinicians cannot confirm whether the weight loss they produce is coming from fat, which is beneficial or from lean tissue, which is metabolically harmful and accelerates the sarcopenic diabetes cycle. GLP-1 receptor agonists similarly produce weight loss that may include significant muscle loss if not accompanied by resistance training and adequate protein intake. InBody body composition tracking is the only way to confirm that pharmacological interventions are producing the right compositional change.
CLINICAL IMPLICATION
The InBody BWA diabetes application explicitly recommends using InBody to assess the side-effects of SGLT-2 inhibitors and GLP-1 receptor agonists on body composition. For every T2DM patient on these agents, serial InBody scans every 8–12 weeks confirm that the medication is producing fat reduction, not muscle loss. If skeletal muscle mass is declining alongside fat mass, resistance training and protein supplementation should be introduced immediately.
Secret 7: Serial Body Composition Tracking Is the Most Powerful Motivational Tool in Diabetes Care
The Challenge of Patient Adherence in Diabetes
Patient adherence to lifestyle interventions is one of the biggest challenges in diabetes management. Patients who are told their HbA1c is 8.1% often do not fully understand what that means for their daily health. They cannot see HbA1c, and they cannot feel it improving.
As a result, the number feels abstract and disconnected. This makes it a weak motivational tool, especially when lifestyle changes require consistent daily effort over a long period.
Why HbA1c Alone Fails to Motivate Change
The problem with HbA1c is simple, it is not tangible. Patients do not experience immediate feedback. They do not see visible progress in their day-to-day lives.
Because of this, many people struggle to stay committed. Without clear, visible results, it becomes difficult to maintain motivation for diet, exercise, and other lifestyle interventions.
How Body Composition Data Changes the Game
Body composition data offers a completely different experience. It makes progress visible, measurable, and personal.
For example, when a patient sees their InBody results, the changes are clear. Their visceral fat level may drop from 12 to 9 over 12 weeks, leg lean mass may increase by 1.2 kg, and their body fat percentage may reduce from 33.8% to 29.4%.
These are not abstract numbers. They are specific improvements that patients can understand and relate to. As a result, they feel more motivated to continue their efforts.
Creating a Strong Motivation Loop with InBody
The InBody BWA diabetes application highlights this advantage clearly. It shows patients what traditional weight scales cannot.
“With a comprehensive body composition report, InBody devices show patients the changes that ordinary weight scales are incapable of showing and provide an educational outline to start a discussion towards lifestyle change.”
In addition, the Body Composition History section tracks progress over time. This creates a continuous feedback loop. Patients can see how their efforts lead to real results, which helps them stay consistent over months and even years.
THE 7 INBODY METRICS THAT TRANSFORM DIABETES MANAGEMENT
1. Visceral Fat Level (VFL): Direct T2DM risk predictor independent of BMI
2. Skeletal Muscle Mass (SMM): Primary glucose disposal capacity is declining in every T2DM patient
3. Skeletal Muscle Index (SMI): Normalised muscle diagnoses sarcopenia in diabetic patients
4. Leg Lean Mass: The primary glucose uptake site most critical for insulin sensitivity
5. Body Fat Percentage: True adiposity identifies 39% more obese diabetic patients than BMI
6. ECW/TBW Ratio: Inflammation + early complication marker detects nephropathy before blood tests
7. InBody Score: Composite metric tracks overall metabolic improvement across serial visits
InBody vs HbA1c and BMI Alone: What Each Tells You
| Clinical Question | HbA1c + BMI Alone | HbA1c + BMI + InBody Body Composition |
|---|---|---|
| Is my patient truly obese? | Only 32.4% correctly identified (PMC 2021) | 71.5% correctly identified by body fat % |
| Why is insulin resistance worsening? | Cannot determine, no fat or muscle data | Identifies visceral fat accumulation, declining SMM, or both simultaneously |
| Is leg muscle mass adequate for glucose disposal? | Cannot assess BMI has no limb data | Segmental leg lean mass measurement most important metabolic tissue |
| Is SGLT-2 inhibitor causing muscle loss? | Cannot detect, only scale weight available | Serial SMM tracking confirms fat vs lean tissue changes |
| Are early diabetic complications developing? | Detected only when blood markers rise | Rising ECW/TBW ratio detects inflammation and early nephropathy earlier |
| Is the patient motivated to continue lifestyle changes? | HbA1c changes slowly poor feedback loop. | Serial body composition history provides immediate, specific motivational data |
Real Case: The Patient Who Was Managing Diabetes With the Wrong Treatment Target
Patient Background and Clinical History
A 49-year-old male marketing professional in Hyderabad had been living with Type 2 diabetes for six years. His HbA1c was 7.8%, indicating moderate control but still above the ideal target. With a BMI of 25.3, he was considered slightly overweight.
His physician had already adjusted his metformin dosage and added a DPP-4 inhibitor. Medication adherence was not an issue, as he followed the treatment plan consistently. However, despite these efforts, his HbA1c had remained above 7.5% for the past 18 months.
Limitations of Traditional Metrics
When a new endocrinologist ordered an InBody scan, a deeper issue became clear. The results revealed what HbA1c and BMI alone had failed to show.
While these traditional markers indicated moderate control, they did not provide insights into fat distribution, muscle mass, or inflammation. As a result, the root cause of poor metabolic control remained hidden.
InBody Scan Findings: The Hidden Problem
The InBody scan highlighted several critical concerns. His Visceral Fat Level was 13, placing him in a high-risk category. In addition, his Skeletal Muscle Mass was 3.1 kg below the expected range for his age and height.
A closer look showed that his leg lean mass was particularly low on both sides. Meanwhile, his Body Fat Percentage stood at 32.4%, which is considered obese based on body composition. The ECW/TBW ratio was 0.413, slightly elevated and suggestive of early inflammatory changes.
Personalized Intervention Plan
A new management plan was designed based on his body composition data. He was advised to perform resistance training three times per week, with a focus on lower-body exercises.
His protein intake was increased to 1.3 g/kg/day to support muscle growth. In addition, an SGLT-2 inhibitor was introduced, with serial InBody monitoring to ensure fat loss without muscle loss.
Regular InBody scans were scheduled every 8 weeks to track progress and make necessary adjustments.
Follow-Up and Progress (12 Weeks)
At his 12-week review:
| ↓3 units Visceral Fat Level (13 → 10) | +1.8 kg Skeletal Muscle Mass gained | ↓0.7% HbA1c reduction (7.8% → 7.1%) | Normal ECW/TBW ratio at 12 weeks |
His BMI had changed by 0.6 units. His pharmacological regimen had not been modified. The improvement in HbA1c was driven entirely by body composition change, increased glucose disposal capacity from muscle gain, and reduced insulin resistance from visceral fat reduction. Neither the problem nor the solution had been visible without body composition analysis.
Frequently Asked Questions
Q. How does body composition affect diabetes?
Body composition directly drives diabetes risk and control through two primary pathways. First, high visceral fat releases inflammatory cytokines (TNF-α, IL-6) and free fatty acids that impair insulin signalling in skeletal muscle, liver, and adipose tissue, causing insulin resistance. Second, low skeletal muscle mass reduces the body’s primary glucose disposal capacity: skeletal muscle handles approximately 80% of insulin-stimulated glucose uptake. A patient with high visceral fat and low muscle mass simultaneously carries the worst possible metabolic profile for diabetes, regardless of their BMI or scale weight.
Q. What is the relationship between skeletal muscle mass and blood sugar?
Skeletal muscle handles approximately 80% of insulin-stimulated glucose uptake, with the legs accounting for 60% of total skeletal muscle mass glucose disposal. When skeletal muscle mass declines as it does progressively in T2DM patients, glucose disposal capacity falls, forcing the pancreas to produce more insulin to compensate and accelerating beta-cell exhaustion. InBody measures leg lean mass and skeletal muscle index (SMI) directly, enabling clinicians to track the single most important metabolic tissue in diabetes management and prescribe targeted resistance training to address leg muscle deficit specifically.
Q. How does InBody help manage type 2 diabetes?
InBody provides seven diabetes-specific metrics in under 60 seconds: Visceral Fat Level (direct T2DM risk predictor), Skeletal Muscle Mass and SMI (glucose disposal capacity and sarcopenia screening), Leg Lean Mass (primary glucose uptake site), Body Fat Percentage with IAP-adjusted Indian reference values, ECW/TBW Ratio (early complication detection), and InBody Score (composite metabolic health tracker). These metrics enable personalised diabetes management targeting the specific body composition deficits driving poor glycaemic control in each patient, and confirming that pharmacological and lifestyle interventions are producing the right compositional response.
Key Takeaways
- HbA1c and BMI tell you the consequence of diabetes. Body composition tells you the cause. Visceral fat drives insulin resistance. Skeletal muscle handles 80% of glucose disposal. Neither is visible on a standard blood panel or weighing scale.
- The 7 secrets: visceral fat as an insulin resistance driver, legs as a primary metabolic organ, the diabetes-sarcopenia cycle, BMI misclassification, ECW/TBW early complication detection, medication monitoring, and motivational tracking all converge on one clinical need: direct body composition measurement at every diabetes visit.
- 71.5% of T2DM patients are obese by body fat percentage versus only 32.4% by BMI. Over a third of Indian diabetic patients are being systematically undertreated because their metabolic risk is invisible to the screening tool in use.
- InBody delivers visceral fat level, skeletal muscle mass, leg lean mass, SMI, body fat percentage, ECW/TBW ratio, and InBody Score in under 60 seconds, providing the complete body composition picture that HbA1c and BMI together cannot deliver.
- SGLT-2 inhibitors and GLP-1 receptor agonists should be monitored with serial InBody scans every 8–12 weeks to confirm that medication-driven weight loss is producing fat reduction, not lean tissue loss, in every T2DM patient on these agents.
- Body composition data is the most powerful motivational tool in diabetes care, providing the specific, personal, visual feedback that HbA1c alone cannot deliver, sustaining adherence across the months and years required to genuinely improve metabolic health.
Defeat Diabetes With Data, Not Guesswork
InBody body composition analysis provides the visceral fat, muscle mass, and fluid data that every diabetes management plan requires beyond HbA1c and BMI in under 60 seconds. Used across endocrinology clinics, diabetes centres, and corporate wellness programmes across India.

Find an InBody Scanner Near You
References & Further Reading
- PMC 2021. Association of Body Composition with T2DM: InBody 770 retrospective chart review, n=2,404. PMC8122668.
- Scientific Reports 2019. Body Composition using DEXA and T2DM: Systematic Review and Meta-Analysis — VFM odds ratios. Nature.
- Signal Transduction and Targeted Therapy 2025. Molecular signatures of skeletal muscle insulin resistance in T2DM. Nature 2025;10:320.
- World Journal of Diabetes 2024. Body composition and metabolic syndrome in T1DM — VFI, skeletal muscle mass, and insulin resistance. WJD 2024;15(1):81–91.
- PMC 2025. BMI and glycaemic control in T2DM — cross-sectional study, n=200, HbA1c correlation. PMC11853989.
- InBody BWA. Diabetes Application — clinical use of InBody for T2DM screening and management. inbodybwa.com.
- Kalra S et al. Indian Consensus on Sarcopenia including T2DM sarcopenic obesity. Int J Gen Med. 2025;18:1731–1745.
- Reviews in Endocrine and Metabolic Disorders 2025. Skeletal muscle atrophy and dysfunction in obesity and T2DM — myocellular mechanisms. Springer Nature.

Most trending articles

InBody vs DEXA vs Skinfold Calipers: Which Body Composition Test Is Right for You in India?
DEXA scans, InBody BIA, skinfold calipers — three different ways to measure body composition. Accuracy comparisons, cost in India, accessibility, and which method makes sense for your specific goal.

Skinny Fat in India: Why 40% of Normal Weight Indians Have Dangerously High Body Fat
India's hidden obesity epidemic. Skinny fat (TOFI — Thin Outside, Fat Inside) affects millions of normal-weight Indians. How body composition testing reveals what BMI hides — and the exact protocol to fix it.

Healthy Body Composition by Age for Indians: Reference Ranges at 20s, 30s, 40s, 50s+
Body composition reference ranges for Indian men and women by age. Find out if your body fat %, muscle mass, and visceral fat level are healthy for your age and what to do if they're not.