Body Composition 14 min read
Is Body Composition Analysis a Serious Medical Tool?
If you are serious about health outcomes, there is one habit that separates people who achieve lasting results from those who do not. It is not the diet…
Reading about body composition? Find an InBody test centre near you →
If you are serious about health outcomes, there is one habit that separates people who achieve lasting results from those who do not. It is not the diet they follow, the exercise routine they choose, or the supplements they take. It is whether they measure their progress in a way that actually reflects what is happening inside their body, not just what a weighing scale says.
A weighing scale gives you one number: total mass. It cannot tell you whether that mass is fat or muscle, cannot show you whether your visceral fat is rising or falling, and it cannot confirm whether your intervention is working or failing. Routine body composition tracking does all of this. Backed by a growing body of peer-reviewed evidence and clinical consensus, it is now recognised as the most reliable method for guaranteeing real, measurable health success for patients and their clinicians. Here are the 7 proven truths that explain why.
| 60 sec Time for a complete InBody scan delivering 5 metrics a weighing scale cannot measure | r = 0.96 Pearson correlation, InBody 770 vs DEXA for fat mass in women (EJCN 2025, n = 1,000) | 8–12 weeks Optimal tracking interval for meaningful physiological change to appear in body composition data | 5 metrics Body fat %, skeletal muscle mass, visceral fat, ECW/TBW ratio, InBody Score all missed by BMI |
Why Routine Body Composition Tracking Changes Everything
Every successful clinical intervention in medicine has one thing in common: measurement. You do not manage blood pressure without checking it, do not treat diabetes without monitoring HbA1c. You do not prescribe thyroid medication without tracking TSH. Yet for decades, the most fundamental metric of metabolic health, body composition, has been managed with a single blunt instrument: the weighing scale.
The scale tells you mass. Body composition tracking tells you what that mass is made of. For patients on diet and exercise programmes, this distinction is the difference between knowing an intervention is working and guessing that it might be. For clinicians, it is the difference between evidence-based metabolic management and symptomatic treatment in the dark.
THE SCALE LIE: A CLINICAL REALITY
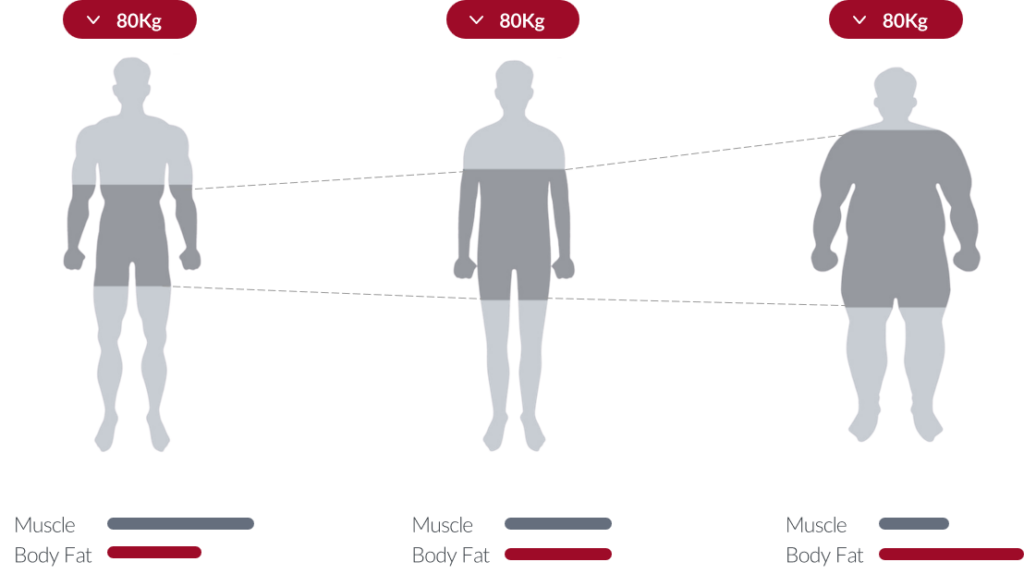
A patient who gains 2 kg of skeletal muscle and loses 2 kg of fat will show zero change on the weighing scale. Their BMI is unchanged. Their metabolic risk profile has significantly improved. But without body composition tracking, a clinician seeing “no change in weight” has no objective basis to continue the intervention or to recognise that it is working perfectly.
Truth 1: Your Scale Lies. Body Composition Tracking Tells the Truth
Body weight fluctuates by 1–3 kg within a single day driven by food intake, hydration, glycogen storage, hormonal cycles, and bowel movements. None of these fluctuations reflect changes in fat mass or muscle mass. Yet most patients step on the scale daily, experience these normal fluctuations, and draw completely wrong conclusions about whether their programme is working.
Worse, weight-focused tracking actively misleads. A person on a resistance training programme who is gaining muscle while losing fat may see their scale weight stay flat or even increase and interpret this as a failure. The opposite is true. Meanwhile, a person on a severely calorie-restricted diet losing both fat and muscle simultaneously may see rapid weight loss on the scale and interpret this as success. Body composition tracking reveals the truth in both cases.
EVIDENCE
A JAMA Network Open 2024 meta-analysis confirmed that sarcopenic obesity, where patients gain fat while losing muscle, is independently associated with elevated all-cause and cardiovascular mortality. This phenotype is invisible on a weighing scale and only detectable through body composition analysis. In Indian patients, this phenotype is further masked by the thin-fat phenotype, making body composition tracking especially critical. Learn more about why BMI misses what body composition tracking reveals.
Truth 2: You Cannot Improve What You Do Not Measure
This is not just a motivational maxim; it is a well-established principle of clinical behaviour change science. People who track objective health metrics achieve significantly better outcomes than those who rely on subjective self-assessment. The mechanism is straightforward: tracking creates feedback loops. Feedback loops enable adjustment. Adjustment produces improvement.
For body composition specifically, this means knowing your actual body fat percentage, skeletal muscle mass, and visceral fat level, not estimating them. When a patient knows their visceral fat level is 12 and their target is below 9, they have a specific, actionable goal. When a patient knows their skeletal muscle mass is 2.1 kg below the population norm, they have a clear target for their resistance training programme. Vague goals produce vague outcomes. Specific measurements produce specific results.
Truth 3: Tracking Catches Hidden Risk Before Blood Tests Do
Elevated fasting glucose, dyslipidaemia, and hypertension are downstream consequences of metabolic deterioration. By the time these markers appear on a blood panel, visceral fat accumulation and skeletal muscle decline have already been progressing for months or years. Routine body composition tracking detects this upstream deterioration before it manifests in blood results that trigger clinical intervention.
This is particularly critical for the Indian patient population, where the thin-fat phenotype means metabolic risk accumulates at BMI levels international guidelines classify as healthy. A patient with a BMI of 23 and a Visceral Fat Level of 11, detected through routine InBody tracking, represents an early intervention opportunity. The same patient with elevated HbA1c two years later represents a missed one.
KEY INSIGHT
The 2025 PMC review on BIA clinical applications confirmed that BIA-derived body composition metrics, particularly ECW/TBW ratio and visceral fat assessment, predict cardiovascular mortality risk and hospitalisation in acute decompensated heart failure patients, ahead of standard blood biomarkers. The review recommends routine BIA assessment for all clinical populations with metabolic comorbidities.
Truth 4: Routine Data Is the Most Powerful Motivation Tool in Existence
Patient adherence to lifestyle interventions is one of the most studied and most challenging problems in clinical medicine. Patients drop out of diet and exercise programmes not because the programmes do not work, but because they cannot see that they are working. Scale weight does not tell them. How they feel is subjective. How they look in a mirror is distorted by perception.
Body composition data is objective, specific, and personal. When a patient sees their InBody result showing that they have gained 1.4 kg of skeletal muscle over 8 weeks, even though their scale weight has barely changed their adherence to the resistance training programme becomes intrinsically motivated. The data becomes the coach. Fitness centres, corporate wellness programmes, and metabolic clinics that integrate routine InBody scanning consistently report higher 12-week programme completion rates than those relying on scale-based feedback alone.

Truth 5: Tracking Tells You Whether Your Intervention Is Actually Working
This is the single most important clinical application of routine body composition tracking. Every diet works in some way. Every exercise programme produces some response. But whether the specific programme a patient is on is producing the right physiological response, fat loss without muscle loss, muscle gain alongside fat reduction, or visceral fat decline can only be confirmed by body composition data.
Consider two common clinical scenarios. First: a patient loses 5 kg over 12 weeks. Without body composition data, this looks like success. With InBody data, you discover they have lost 2 kg of fat and 3 kg of muscle, a net deterioration in metabolic health. Second: a patient’s scale weight is unchanged after 8 weeks. Without body composition data, this looks like a failure. With InBody data, you discover they have lost 2.5 kg of fat and gained 2.5 kg of muscle, a significant improvement in body composition and metabolic risk profile.
CLINICAL IMPLICATION
Never assess the success of a fat loss or muscle gain programme by scale weight or BMI alone. A 2020 ScienceDirect study (McLester et al.) confirmed that InBody analysers show intraclass correlation coefficients for body fat percentage (≥0.98), fat mass (≥0.98), and fat-free mass (≥0.99) across repeated measurements, making them reliable enough to detect clinically meaningful changes between sessions when standardised protocols are followed.
Truth 6: The Frequency of Tracking Determines the Accuracy of Your Clinical Decisions
A one-time InBody scan gives you a baseline. It tells you where a patient is right now. That is valuable. But it cannot tell you the direction they are heading, the rate of change, or whether an intervention has shifted their trajectory. Only serial tracking scans repeated at consistent intervals provide this information.
A Visceral Fat Level of 11 in isolation is concerning; that has moved from 14 to 11 over 12 weeks is evidence of successful intervention. A Visceral Fat Level that has moved from 9 to 11 over 12 weeks, despite the patient reporting adherence, is a clinical signal that their programme needs adjustment. None of this information exists without routine tracking.
EVIDENCE
The 2025 European Journal of Clinical Nutrition study of 1,000 adults confirmed that InBody multi-frequency BIA demonstrated strong population-level agreement with DEXA for total body fat mass (r = 0.93 for men, r = 0.96 for women) and visceral adipose tissue, validating its use as a reliable serial tracking tool for routine clinical practice.
Truth 7: Body Composition Tracking Is Now Validated at the Highest Clinical Level
For many years, body composition assessment was considered a research tool valuable in academic settings but not yet standard in clinical practice. That position has changed significantly with the publication of multiple 2025 validation studies and clinical consensus documents that explicitly place InBody BIA within published clinical protocols.
The Indian Consensus on Sarcopenia (2025) explicitly recommends InBody BIA as the primary practical tool for skeletal muscle mass assessment in clinical settings. A 2025 Sensors journal validation study of InBody 770 against D2O and DEXA found a CCC of 0.99 for fat mass among the highest agreement levels ever reported for any BIA device. In 2025 alone, InBody BIA was validated in: a 1,000-adult DEXA comparison study (EJCN), a 55-female D2O 4-compartment model study (Sensors), a 108-participant Frontiers study, and a 100-adult multi-model DEXA comparison (KJHP).
CLINICAL VALIDATION SUMMARY
The 2025 PMC review on BIA instruments confirms that multi-frequency BIA with octopolar configuration, the technology used by InBody, is the recommended standard for hospital body composition assessment globally. The review notes that InBody devices consistently produce the highest reported ICC and CCC values among commercially available BIA platforms. Learn how InBody BIA technology works.
How Often Should You Track? The Evidence-Based Schedule
The optimal tracking frequency depends on who the patient is and what clinical objective you are working toward. Here is the evidence-based framework used by leading metabolic clinics and InBody partners across India:
| Tracking Frequency | Who It Is For | Clinical Objective |
|---|---|---|
| Every 4–6 weeks | Active fat loss or muscle gain programme participants | Detect early non-response; adjust protein, training, or caloric targets before 12 weeks of effort is wasted |
| Every 8–12 weeks | General health maintenance; corporate wellness participants | Monitor visceral fat trends, muscle mass preservation, and InBody Score trajectory across the year |
| Every 12–16 weeks | T2DM, CKD, COPD, heart failure, and sarcopenia patients | Track sarcopenia progression, metabolic response to treatment, and ECW/TBW ratio as an inflammation marker |
STANDARDISATION FOR ACCURATE SERIAL TRACKING
For meaningful serial comparisons, always scan under the same conditions: same time of day (early morning is ideal), minimum 2–4 hours fasted, after voiding, without exercise in the preceding 12 hours, and without alcohol in the preceding 24 hours. These conditions minimise hydration variability, the primary source of day-to-day BIA fluctuation. Document the scan conditions alongside every result in the patient record.
What InBody Body Composition Tracking Actually Measures
Each InBody scan delivers a complete body composition profile in under 60 seconds. Here is what you are tracking and why each metric matters clinically for Indian patients:
| Metric | What It Measures | Why It Matters Clinically | Detectable by Scale / BMI? |
|---|---|---|---|
| Body Fat Percentage | Fat mass as a percentage of total body weight | True adiposity independent of total weight catches the thin-fat phenotype BMI misses | No |
| Skeletal Muscle Mass | Lean muscle in kg measured per limb and trunk | Metabolic rate, glucose disposal capacity, sarcopenia screening | No |
| Visceral Fat Level | Fat surrounding internal organs on a 1–20 scale | T2DM, cardiovascular disease, MASLD, hypertension risk invisible to BMI | No |
| ECW/TBW Ratio | Extracellular to total body water ratio | Systemic inflammation, cellular health, nutritional status predicts hospitalisation risk | No |
| InBody Score | Composite health index from 0–100 | Single-number tracking of overall body composition quality over time | No |
Real Case: 12 Weeks of Tracking That Changed a Diagnosis
A 36-year-old marketing executive in Mumbai had been trying to lose weight for two years. She had tried three different diets. She had lost weight twice, once 4 kg, once 6 kg, only to regain it both times. Her BMI was 24.7. Her GP said she was healthy. She felt exhausted and was struggling to concentrate at work.
Her first InBody scan at a corporate wellness programme revealed the problem: Visceral Fat Level of 10 (high risk threshold), Body Fat Percentage of 34.2% (obese by composition), and Skeletal Muscle Mass 2.8 kg below population norm for her age and height. She had been losing weight through caloric restriction alone, losing both fat and muscle simultaneously. Her muscle deficit was suppressing her metabolism, making each diet harder and each rebound faster.
After starting resistance training three times per week and increasing protein intake to 1.3 g/kg/day, her 8-week follow-up InBody scan showed:
| +1.9 kg Skeletal Muscle Mass gained | ↓3.6% Body Fat Percentage reduced | ↓2 units Visceral Fat Level reduced | +8 points InBody Score improvement |
Her scale weight had changed by less than 1 kg. Without the InBody tracking data, she would have concluded again that her programme was not working. With the data, she had objective proof of the most significant body composition improvement of her life. She continued the programme. At her 12-week scan, her visceral fat had dropped to 8 below the risk threshold for the first time in years.
Who Should Track Body Composition Routinely?
Everyone benefits from at least a baseline body composition measurement. But the following groups benefit most from routine tracking at regular intervals:
- Patients with T2DM, metabolic syndrome, CKD, or COPD: Body composition tracking monitors sarcopenia progression, visceral fat trends, and ECW/TBW ratio as an inflammation marker, all of which directly affect disease management decisions
- Individuals on structured diet or exercise programmes: Tracking confirms whether fat is being lost without muscle loss, the defining difference between a programme that improves metabolic health and one that only reduces scale weight
- People over 40 at risk of sarcopenia: Skeletal muscle mass declines at 1–2% per year from age 40. Serial tracking catches this loss before it becomes clinically significant, when lifestyle intervention is still fully effective
- Athletes and fitness-focused individuals: Tracking muscle gain and fat loss independently provides training programme feedback that body weight and BMI cannot deliver
- Anyone with normal BMI but abnormal metabolic markers: The thin-fat Indian phenotype, high body fat and visceral fat at normal BMI, is only detectable through body composition analysis. Routine tracking identifies this risk profile before blood panels flag it
Frequently Asked Questions
Q. How often should I track body composition?
For most patients, every 8–12 weeks gives enough time for meaningful physiological changes to show in the data. Those actively working on a fat loss or muscle gain programme, every 4–6 weeks, allows more precise tracking and earlier intervention if the programme needs adjustment. For clinical monitoring of sarcopenia, metabolic syndrome, or CKD, quarterly tracking is the minimum standard.
Q. Is InBody body composition tracking accurate?
Multiple 2025 peer-reviewed studies validate InBody BIA against DEXA and 4-compartment models. A 2025 Sensors study found that InBody 770 showed a CCC of 0.99 for fat mass versus DEXA and D2O, among the highest agreement levels ever reported for any BIA device. A 2025 European Journal of Clinical Nutrition study of 1,000 adults confirmed correlations of r = 0.93–0.96 for fat mass versus DEXA. The Indian Consensus on Sarcopenia 2025 recommends InBody BIA as the primary practical tool for routine body composition assessment in Indian clinical settings.
Q. Who should track body composition routinely?
Everyone benefits from a baseline body composition measurement, but routine tracking is especially important for: patients with T2DM, metabolic syndrome, CKD, or COPD; individuals on structured diet or exercise programmes; people over 40 at risk of sarcopenia; athletes tracking training adaptation; and anyone with a normal BMI but abnormal metabolic markers the thin-fat phenotype that is disproportionately prevalent in Indian patients and is only detectable through direct body composition analysis.
Key Takeaways
- A weighing scale gives you one number: total mass. Routine body composition tracking gives you body fat percentage, skeletal muscle mass, visceral fat level, ECW/TBW ratio, and InBody Score, the five metrics that actually predict metabolic health.
- The 7 proven truths confirm that body composition tracking improves diagnostic accuracy, programme adherence, clinical decision-making, early risk detection, and intervention outcomes in ways no scale-based approach can match.
- Body composition changes appear before blood test abnormalities, creating an early intervention window that is especially important for the thin-fat Indian phenotype, where metabolic risk accumulates at healthy BMI levels.
- The optimal schedule is every 4–6 weeks for active programme participants, every 8–12 weeks for general health maintenance, and every 12–16 weeks for chronic disease monitoring.
- InBody BIA is validated in multiple 2025 peer-reviewed publications and is explicitly recommended in the Indian Consensus on Sarcopenia 2025 as the primary practical body composition assessment tool for Indian clinical settings.
- Always standardise scan conditions same time, fasted, after voiding, no exercise or alcohol in the preceding 12–24 hours to ensure serial scans are directly comparable for clinical decision-making.
See What Your Body Is Really Made Of And Track It Over Time
An InBody scan takes under 60 seconds and delivers 5 clinically validated body composition metrics, giving you the tracking data your weighing scale will never provide. Available at hospitals, fitness centres, and corporate wellness programmes across India.

Find an InBody Scanner Near You
References & Further Reading
- Potter AW et al. Real-world assessment of InBody 770 MFBIA vs DEXA in 1,000 adults. European Journal of Clinical Nutrition. 2025;79:1235–1244.
- Validation of InBody 770 against D2O and DEXA in 55 adult females. Sensors. 2025;25(16):5037.
- Wearable BIA vs InBody 770 vs DEXA in 108 participants. Frontiers in Sports and Active Living. 2025.
- Son JW et al. Development and clinical application of BIA for body composition assessment. Obesity Reviews. 2025;26:e13844. (PMC)
- McLester CN et al. Reliability and Agreement of Various InBody Analyzers vs DXA. Journal of Clinical Densitometry. 2020.
- Kalra S et al. An Indian Consensus on Sarcopenia. International Journal of General Medicine. 2025;18:1731–1745.
- Benz E et al. Sarcopenic Obesity and Mortality Among Older People. JAMA Network Open. 2024;7(3):e243604.
- Comparison of InBody970, InBody770, InBody270 vs DEXA. Korean Journal of Health Promotion. 2025.

Most trending articles

InBody vs DEXA vs Skinfold Calipers: Which Body Composition Test Is Right for You in India?
DEXA scans, InBody BIA, skinfold calipers — three different ways to measure body composition. Accuracy comparisons, cost in India, accessibility, and which method makes sense for your specific goal.

Skinny Fat in India: Why 40% of Normal Weight Indians Have Dangerously High Body Fat
India's hidden obesity epidemic. Skinny fat (TOFI — Thin Outside, Fat Inside) affects millions of normal-weight Indians. How body composition testing reveals what BMI hides — and the exact protocol to fix it.

Healthy Body Composition by Age for Indians: Reference Ranges at 20s, 30s, 40s, 50s+
Body composition reference ranges for Indian men and women by age. Find out if your body fat %, muscle mass, and visceral fat level are healthy for your age and what to do if they're not.