Body Composition 5 min read
Body Fat Percentage Chart for Indians (Men, Women, Age)
If you are looking up “body fat percentage chart” in India, here is the problem: most charts you will find online use American or European thresholds. Indian bodies…
Reading about body composition? Find an InBody test centre near you →
If you are looking up “body fat percentage chart” in India, here is the problem: most charts you will find online use American or European thresholds. Indian bodies do not fit those ranges. We carry more visceral fat at a lower BMI, our muscle mass tends to be lower for our height, and our risk of diabetes and heart disease kicks in at a body fat percentage where a Caucasian person might still be considered healthy.
This guide gives you the body fat percentage chart that actually applies to Indians — by gender, by age, and by goal — plus what your number really means for your health.
Why a separate body fat chart for Indians matters
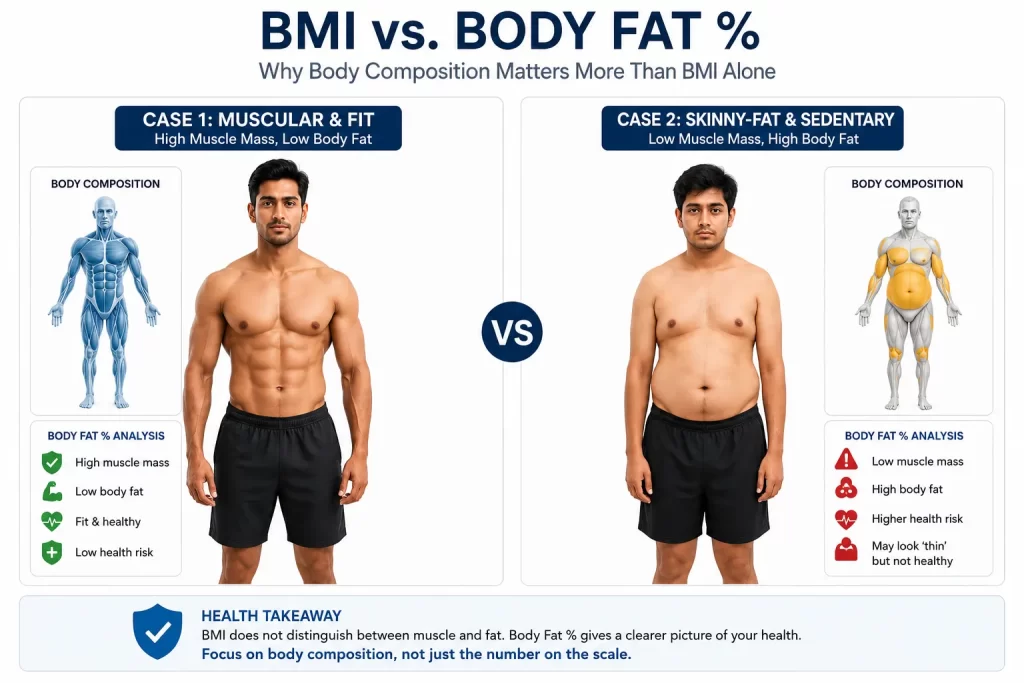
Indians have what researchers call the “thin-fat” phenotype. We can look slim, have a normal BMI, and still carry significantly more body fat (especially around the abdomen) than people of European descent. Studies from AIIMS and the Indian Council of Medical Research (ICMR) consistently show:
- Indians have ~3–5% higher body fat at the same BMI compared to Caucasians.
- Asian-specific BMI thresholds (used by the WHO for India) classify overweight at 23 kg/m² and obesity at 25 kg/m² — versus 25 and 30 for Western populations.
- Diabetes and metabolic syndrome risk in Indians rises sharply above 25% body fat for men and 32% for women — well before a standard scale or BMI flags a problem.
This is why body composition matters more than BMI for Indians. Two people can weigh the same and have the same BMI, but one is healthy, and the other is one step from a diagnosis.
Body fat percentage chart for Indian men
| Category | Age 20–39 | Age 40–59 | Age 60+ |
|---|---|---|---|
| Essential fat (minimum) | 3–5% | 3–5% | 3–5% |
| Athletic / very fit | 6–13% | 11–17% | 13–19% |
| Healthy/fit | 14–19% | 18–22% | 20–24% |
| Acceptable | 20–24% | 23–27% | 25–29% |
| Overweight | 25–29% | 28–32% | 30–34% |
| Obese (health risk) | 30%+ | 33%+ | 35%+ |
For most Indian men under 40, the goal range is 14–19% body fat. That is where you have visible muscle definition, strong metabolic health, and protection against the cluster of conditions that hits Indian men hard after 35 — hypertension, type 2 diabetes, and early cardiovascular disease.
Body fat percentage chart for Indian women
| Category | Age 20–39 | Age 40–59 | Age 60+ |
|---|---|---|---|
| Essential fat (minimum) | 10–13% | 10–13% | 10–13% |
| Athletic / very fit | 14–20% | 15–23% | 16–25% |
| Healthy/fit | 21–24% | 24–30% | 25–32% |
| Acceptable | 25–31% | 31–35% | 33–36% |
| Overweight | 32–36% | 36–40% | 37–41% |
| Obese (health risk) | 37%+ | 41%+ | 42%+ |
Women naturally carry more body fat than men because of their essential reproductive function. For Indian women, the sweet spot is 21–24% body fat — high enough for hormonal health, low enough to keep PCOS, insulin resistance, and visceral fat-driven diseases at bay.
Note: Women below 18% body fat for sustained periods can lose their menstrual cycle. Going lower is rarely worth the trade-off unless you are a competitive athlete with medical supervision.
What the chart cannot tell you (and the InBody scan can)

A percentage on its own is not enough. Two people with 22% body fat can have wildly different health profiles depending on:
- Visceral fat — the deep abdominal fat wrapped around your liver, pancreas, and intestines. This is the dangerous fat. A normal body fat % with high visceral fat is still high-risk.
- Segmental muscle distribution — are you carrying muscle proportionally, or is your upper body weak and lower body bulky? Indians often have underdeveloped arm musculature.
- Skeletal muscle mass — total muscle reserve, which directly predicts insulin sensitivity and longevity.
- Body water balance (ECW/TBW) — flagged by InBody, this catches inflammation, kidney issues, and lymphedema that body fat % alone misses.
- Phase angle — a cell-health number that goes well beyond fat percentage. More on phase angle here.
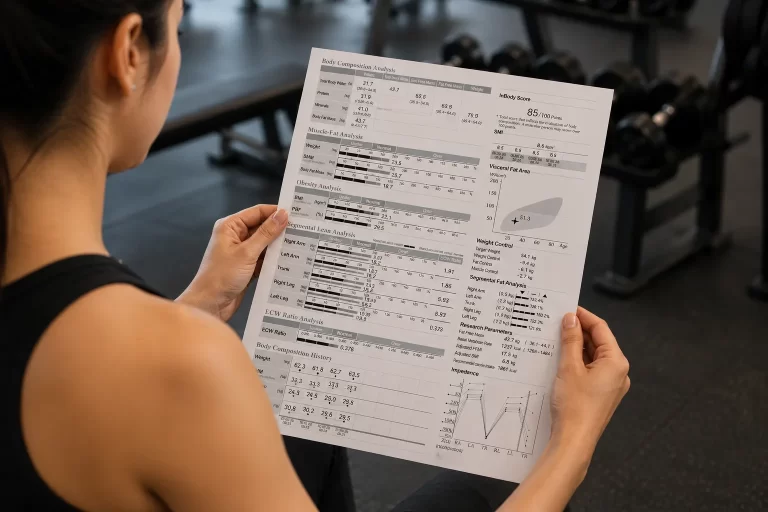
This is the difference between knowing your body fat percentage and actually understanding your body composition. A 60-second InBody scan gives you all of this in one printed sheet.
How to lower your body fat percentage (the realistic path)
If you are above the healthy range, the fastest sustainable rate of body fat loss is about 0.5–1% per month. Beyond that, you start losing muscle along with fat, which slows your metabolism and almost always leads to rebound weight gain.
The non-negotiables:
- Protein at 1.6–2.2 g per kg bodyweight per day. Indian diets are typically protein-deficient (average of 60–65 g/day versus the ICMR recommendation of 1 g/kg and the muscle-preservation target of 1.6 g/kg). Fix this first.
- Resistance training 3–4×/week. Not just cardio. Walking and treadmill alone will lose you muscle along with fat. See the full muscle-building protocol here.
- Calorie deficit of 300–500 kcal/day. Aggressive cuts (over 1,000 kcal deficit) almost always backfire for Indians because they are usually achieved by cutting protein, not just carbs.
- Sleep 7+ hours. Sleep debt raises cortisol, which preferentially stores belly fat exactly where Indians do not need more.
- Track body composition, not just weight. The scale lies. If you lose 4 kg of weight but 2 kg of it was muscle, you have made yourself less healthy. Only an InBody scan can tell the difference.
Frequently asked questions
Q. What is a healthy body fat percentage for an Indian man at 30?
Between 14% and 19% is the healthy fit range. Below 14% is athletic. Above 25% triggers diabetes and heart disease risk much earlier in Indians than in Western populations.
Q. Is 25% body fat acceptable for an Indian woman in her 30s?
Yes, 25% is in the acceptable range for women aged 20–39. The healthy fit range is 21–24%. Above 32% starts triggering significantly higher metabolic and hormonal risk.
Q. Why are Indian body fat thresholds different from Western charts?
Indians have the “thin-fat” phenotype — higher body fat and visceral fat at the same BMI compared to people of European descent. This is genetic and well-documented. Asian-specific BMI thresholds for overweight and obesity start at 23 and 25 kg/m² (versus 25 and 30 for Western populations).
Q. Can I measure body fat percentage at home?
Yes, with a smart body composition scale like the InBody Dial H40 or H30, which uses the same BIA technology as professional InBody machines (just at a consumer price point). Skinfold callipers are less reliable, especially for higher body fat ranges. Bathroom scales that “estimate” body fat are typically off by 5–10%.
Q. How accurate is the InBody scan vs DEXA for body fat percentage?
InBody body composition analysers have a 98.4% correlation with DEXA scans in clinical validation studies. The InBody is faster (60 seconds vs 10–20 minutes), uses zero radiation, and costs a fraction per scan. Full InBody vs DEXA comparison here.
Stop guessing your body fat percentage. An InBody scan gives you body fat, muscle mass, visceral fat, segmental balance, and phase angle — all in 60 seconds. Find an InBody test centre near you or compare InBody home scales to track your numbers weekly.

Most trending articles

Healthy Body Composition by Age for Indians: Reference Ranges at 20s, 30s, 40s, 50s+
Body composition reference ranges for Indian men and women by age. Find out if your body fat %, muscle mass, and visceral fat level are healthy for your age and what to do if they're not.
How to Read Your InBody Report: Every Number Explained Simply
Your InBody report has 15+ numbers. This guide explains what SMM, PBF, ECW/TBW ratio, visceral fat level, and segmental analysis mean — and what to actually do with each result.

Metabolic Age Explained: What It Reveals About Your Real Health (And How to Lower It)
Metabolic age vs chronological age. What it means, why many Indians in their 30s have the metabolism of a 50-year-old, and 5 evidence-based steps to reverse metabolic aging.