Body Composition 9 min read
Body Composition Results Explained: A Simple Guide
Everything you need to know about what it measures, why BMI fails, how InBody technology works, and what every number on your result sheet actually means. InBody body…
Reading about body composition? Find an InBody test centre near you →
Everything you need to know about what it measures, why BMI fails, how InBody technology works, and what every number on your result sheet actually means.
InBody body composition analysis reveals the metabolic parameters that BMI and standard scales cannot detect.
For decades, the Body Mass Index (BMI) has been the go-to health metric, a simple ratio of weight to height. But as our understanding of health deepens, one thing has become clear: BMI cannot tell you what your body is actually made of. Body composition analysis can. This guide explains everything you need to know, from what it measures to how to read your first result.

The limitations of BMI and why they matter
BMI was created in the 1830s by a Belgian mathematician studying population statistics. It was never designed to assess individual health. Yet it became the world’s default health screening tool largely because it requires nothing more than a scale and a measuring tape.
The formula is straightforward: weight in kilograms divided by height in metres squared. That single number is then labelled Underweight, Normal, Overweight, or Obese. The problem? BMI cannot distinguish between fat and muscle. A kilogram of fat and a kilogram of muscle weigh the same.
The three critical BMI failures
1. It cannot separate fat from muscle:
A highly trained athlete may be classified as “overweight” by BMI because dense muscle raises the scale reading, despite very low body fat and excellent metabolic health.
2. It cannot locate where fat is stored:
Visceral fat, the dangerous fat wrapping around your organs, carries far greater health risks than fat stored under the skin. BMI sees only total weight, not fat distribution.
3. It is inaccurate for Indian populations:
Indians have higher body fat at lower BMI values than Western populations. A BMI of 23 “normal” globally, may already carry metabolically dangerous fat levels by Indian-specific thresholds.
The skinny fat problem in India
Studies estimate 30–40% of normal-weight Indians have metabolically obese body compositions, high fat, low muscle, elevated visceral fat, completely invisible to BMI. Body composition analysis is the appropriate screening tool.
What is body composition analysis?
Body composition analysis measures what your body is physically made of, separating total body weight into fat mass, muscle mass, bone mineral content, and water. Instead of asking “how much do you weigh?”, it asks a far more useful question: “What is your weight made of?”
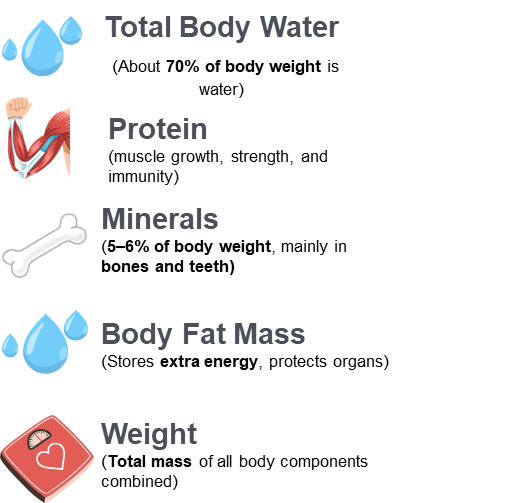
The Core Difference: “A scale measures gravity’s pull on your total mass. Body composition analysis measures the biological quality of that mass; one tells you how much you weigh, the other tells you whether you are metabolically healthy.”
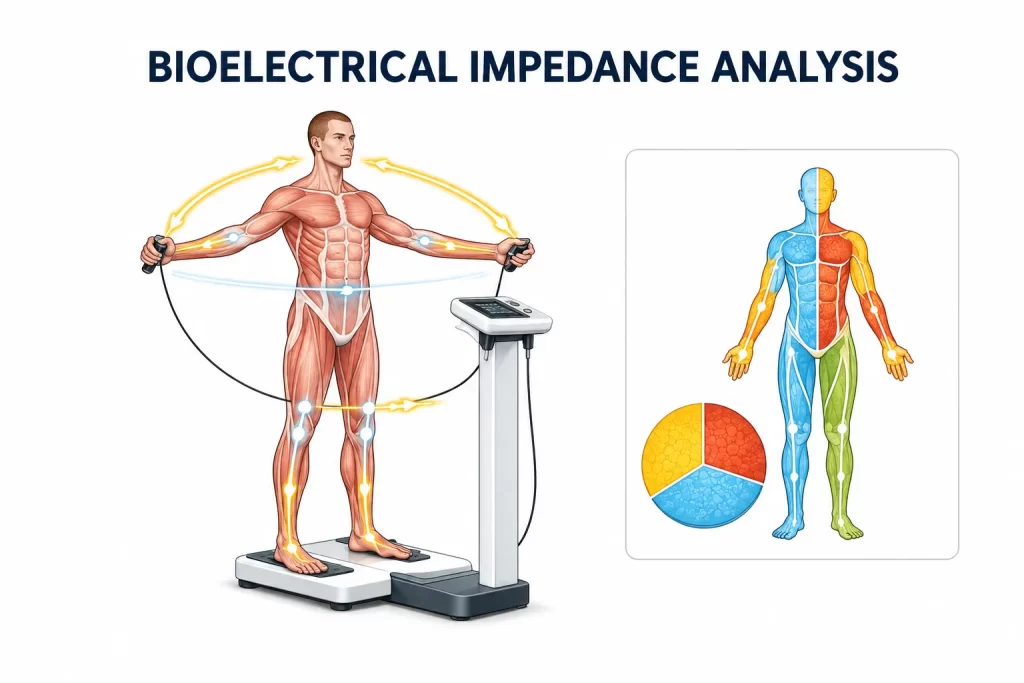
How does InBody BIA technology work?
InBody uses Bioelectrical Impedance Analysis (BIA), the gold standard for clinical body composition assessment in outpatient settings. The test takes under 60 seconds.
The science in plain language
Different tissues conduct electricity at different speeds. Muscle contains lots of water and conducts easily. Fat contains very little water and resists current. InBody sends a safe, low-level electrical current through your body too weak to feel and precisely measures how quickly it travels through different tissue types, then mathematically calculates the exact mass of each.
BIA technology: How InBody measures your body
Is BIA safe?
Completely. The electrical current used is far below the threshold of human perception, approximately 500 microamperes. It is safe for all adults, though not recommended for people with implanted electronic devices such as pacemakers.
What body composition analysis measures parameter by parameter
- Skeletal Muscle Mass (SMM): Total metabolically active muscle. Primary driver of resting energy expenditure and glucose disposal.
- Body Fat Mass & Percentage: Total fat weight and its proportion of body weight. Includes subcutaneous and visceral fat.
- Visceral Fat Level: Rated 1–20. Fat around internal organs. Strongly linked to insulin resistance, heart disease, and Type 2 diabetes.
- Phase Angle: A measure of cellular membrane integrity. Low values indicate poor cellular function or chronic inflammation.
- Basal Metabolic Rate (BMR)Resting calorie requirement calculated from fat-free mass. Essential for personalised nutrition planning.
- Segmental Lean Analysis: Muscle measured separately in the arms, legs, and trunk. Reveals imbalances invisible on overall scans.
- ECW/TBW Ratio: Ratio of extracellular to total body water. Elevated values may indicate inflammation or fluid imbalance.
- Fat-Free Mass (FFM): All non-fat tissue, muscle, bone, organs, and water. The metabolically active component of body weight.
Healthy reference ranges: What the numbers mean
Body fat percentage for general adults ranges
| Category | Men | Women | Clinical Significance |
|---|---|---|---|
| Very Low | <6% | <14% | Risk of hormonal disruption, bone loss |
| Healthy | 10–20% | 18–28% | Associated with optimal metabolic function |
| Borderline High | 21–25% | 29–35% | Increased metabolic risk intervention advised |
| High | >25% | >35% | Significant cardiovascular and metabolic risk |
Visceral fat level in the InBody scale
| InBody Level | Status | Recommended Action |
|---|---|---|
| 1 – 9 | Normal range | Continue current lifestyle monitoring annually. |
| 10 – 14 | Elevated | Dietary modification and exercise intervention are advised |
| 15 – 20 | High risk | Urgent metabolic review, medical management required |
Indian-specific consideration: Asian populations are recommended to use lower body fat and visceral fat thresholds than global averages. A visceral fat level of 9 may be acceptable by Western standards, but warrants intervention in an Indian patient. Always consult a clinician familiar with population-specific risk assessment.
Types of body composition analysers
| Method | How it works | Clinical use | InBody? |
|---|---|---|---|
| BIA (InBody) | Electrical impedance through tissue | Outpatient clinics, gyms, hospitals | Yes, InBody uses BIA |
| DEXA Scan | Dual-energy X-ray absorptiometry | Bone density + body fat hospital research | 98.4% correlation to DEXA |
| Air Displacement (Bod Pod) | Air pressure measures body volume | Research settings rare in India | Separate device |
| Home BIA Scales | Basic 4-point BIA (feet only) | Consumer low clinical accuracy | 8 point home dial devices |
The five clinical benefits of body composition analysis
- Personalised health insights: Two patients weighing 80 kg can require completely different interventions depending on their muscle-fat ratios. Body composition data enables truly tailored recommendations rather than generic advice based on weight categories.
- Objective progress tracking: Regular scans reveal changes the scale cannot detect, such as simultaneous fat loss and muscle gain (body recomposition), where weight may remain stable for weeks while health dramatically improves.
- Early detection of metabolic risk: Elevated visceral fat, declining muscle mass, and falling phase angle values appear on body composition analysis months or years before they manifest as diabetes, cardiovascular disease, or sarcopenia.
- Precision nutritional guidance: BMR calculated from fat-free mass, not total weight, gives the accurate resting calorie requirement needed to design effective, personalised nutrition plans. Protein targets are similarly more precise.
- Sports performance optimisation: For athletes, segmental lean analysis reveals muscle imbalances between limbs, trunk strength relative to extremities, and changes through training cycles, information that directly informs training design and injury risk management.

How to get the most accurate InBody scan results
Body composition results can be influenced by hydration, food intake, and physical activity. Follow these guidelines before your scan for the most consistent results.
- Test in the morning, before eating or drinking, if possible
- Avoid vigorous exercise for at least 12 hours before the test
- Empty your bladder before stepping on the device
- Remove shoes, socks, and any metal jewellery
- Hold the hand grips firmly and stand still for the duration
- Test at the same time of day for all follow-up comparisons
- Inform the clinician if you have a pacemaker or an implanted electronic device
Day-to-day variation is normal: Numbers fluctuate slightly based on hydration. What matters for clinical tracking is the trend over time, monthly or quarterly scans compared against your personalised baseline.
Frequently asked questions
Q. Why do doctors still use BMI if it is considered inaccurate?
BMI was designed in the 1830s as a tool for studying large populations, not for individual medical diagnosis. It remains popular because it is fast and requires no equipment, but it is increasingly being replaced in clinical settings by more precise technology like InBody’s bioelectrical impedance analysis.
Q. Can I have a healthy BMI and still be at risk for heart disease?
Yes. This is often called Normal Weight Obesity. You may have a normal weight for your height, but if your body composition shows high body fat and low muscle mass, your cardiovascular risk is similar to someone who is clinically obese. This is especially common in India due to the thin-fat phenotype.
Q. How does body composition analysis “see” my fat and muscle?
It uses Bioelectrical Impedance Analysis (BIA), sending safe, low-level electrical currents through the body. Because muscle contains a high percentage of water and fat does not, the device can mathematically calculate the exact volume of each tissue type. InBody’s eight-point electrode system gives segmental analysis capability not available on simple home scales.
Q. Will my body composition results change throughout the day?
Yes, results can be influenced by hydration levels, food intake, and recent exercise. For the most accurate and comparable tracking, test in the morning on an empty stomach before any strenuous physical activity, and always test at the same time of day for follow-up scans.
Key takeaways
- The BMI blind spot: BMI fails to distinguish muscle from fat, misclassifying muscular individuals as overweight and thin-fat individuals as healthy. Body composition analysis closes this gap with objective measurement.
- Visceral fat is the real danger: Unlike BMI, body composition analysis measures visceral fat the fat around internal organs. This is the strongest predictor of metabolic syndrome, heart disease, and Type 2 diabetes.
- Muscle is a health metric: Your health is defined more by what you have (muscle mass) than what you weigh. High muscle mass drives metabolic rate. Low muscle mass is linked to premature ageing and metabolic disease.
- Hydration and cellular health matter: InBody tracks intracellular and extracellular water and phase angle markers of chronic inflammation and cellular integrity that a standard scale would never detect.
- Actionable data over guesswork: Body composition analysis gives clinicians a biological map enabling precise, data-driven interventions for nutrition and exercise rather than generic weight-loss goals based on population averages.
Add body composition analysis to your clinic
Join hundreds of diabetes, metabolic, and wellness clinics across India already using InBody to give patients objective, actionable health data beyond what any scale can provide.
Ready to get your first body composition scan?

Find an InBody Scanner Near You
Medical Disclaimer: This article is for informational and educational purposes only. It does not constitute medical advice, diagnosis, or treatment recommendations. Body composition results should always be interpreted in conjunction with a full clinical evaluation by a qualified healthcare provider. InBody devices are not intended to diagnose, treat, or cure any medical condition.
References & further reading
- PMC 2021. Association of Body Composition with T2DM: InBody 770 retrospective chart review, n=2,404.
- Scientific Reports 2019. Body Composition using DEXA and T2DM: Systematic Review and Meta-Analysis. Nature.
- Signal Transduction and Targeted Therapy 2025. Molecular signatures of skeletal muscle insulin resistance in T2DM. Nature.
- World Journal of Diabetes 2024. Body composition and metabolic syndrome. WJD 2024;15(1):81–91.
- PMC 2025. BMI and glycaemic control in T2DM — cross-sectional study, n=200.
- InBody BWA. Diabetes Application — clinical use of InBody for T2DM screening.
- Kalra S et al. Indian Consensus on Sarcopenia. Int J Gen Med. 2025;18:1731–1745.
- Reviews in Endocrine and Metabolic Disorders 2025. Skeletal muscle atrophy in obesity and T2DM. Springer Nature.

Most trending articles

InBody vs DEXA vs Skinfold Calipers: Which Body Composition Test Is Right for You in India?
DEXA scans, InBody BIA, skinfold calipers — three different ways to measure body composition. Accuracy comparisons, cost in India, accessibility, and which method makes sense for your specific goal.

Skinny Fat in India: Why 40% of Normal Weight Indians Have Dangerously High Body Fat
India's hidden obesity epidemic. Skinny fat (TOFI — Thin Outside, Fat Inside) affects millions of normal-weight Indians. How body composition testing reveals what BMI hides — and the exact protocol to fix it.

Healthy Body Composition by Age for Indians: Reference Ranges at 20s, 30s, 40s, 50s+
Body composition reference ranges for Indian men and women by age. Find out if your body fat %, muscle mass, and visceral fat level are healthy for your age and what to do if they're not.