Body Composition 9 min read
How to Read Your InBody Report: Every Number Explained Simply
Your InBody report has 15+ numbers. This guide explains what SMM, PBF, ECW/TBW ratio, visceral fat level, and segmental analysis mean — and what to actually do with each result.
Reading about body composition? Find an InBody test centre near you →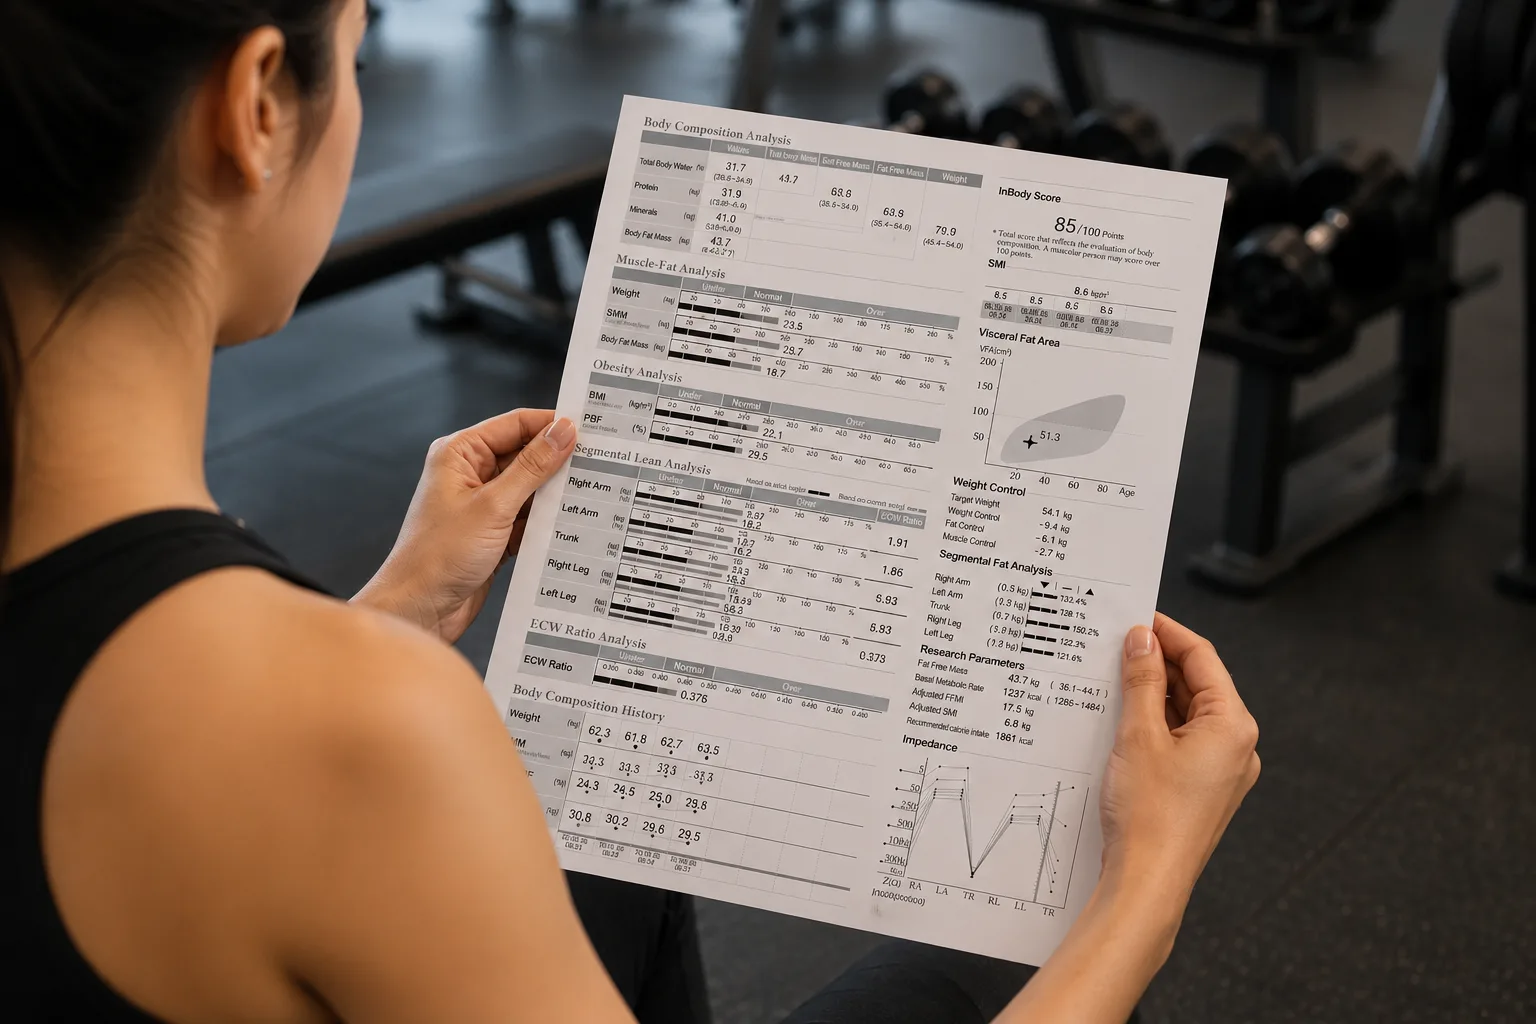
Your InBody Report Has 15+ Numbers. Most People Look at One.
You step off the InBody machine. The printout comes out. Your eye goes straight to one number — body weight — and you either feel good or bad about it.
Then the sheet goes into your bag and gets forgotten.
This is a problem. Because body weight is arguably the least important number on your InBody report. The report is a detailed map of what is happening inside your body — muscle distribution, fat location, inflammation markers, metabolic rate, health risk indicators. Most people never read it.
This guide explains every number, what the healthy ranges are for Indians, and what to actually do with your results.
Section 1: Body Weight and BMI — The Least Important Numbers
Yes, they are on the report. No, they should not be your focus.
Body weight is a sum of everything: muscle, fat, water, bone, organs. Two people at 75kg can have completely different health profiles — one with 18% body fat and strong muscle mass, another with 32% body fat and minimal muscle.
BMI (Body Mass Index) has an additional problem for Indians: it was calibrated on Western populations with different body composition patterns. Indian bodies tend to carry more visceral fat at lower BMI values. A BMI of 23 (technically “normal” by WHO standards) can still correspond to dangerous visceral fat levels in an Indian adult — a phenomenon documented extensively in Indian cardiovascular research.
Use body weight to track overall trends across months. Do not use it to assess health or body composition quality.
Section 2: Skeletal Muscle Mass (SMM) — The Number You Want to Grow
Skeletal muscle mass is the weight of your actual functional muscle — the tissue attached to bones that moves your body. This is distinct from smooth muscle (organs) and does not include fat or water weight.
Why it matters:
- Muscle is metabolically active — it burns calories even at rest
- Higher SMM is strongly associated with lower diabetes risk, better insulin sensitivity, and lower all-cause mortality
- SMM declines naturally with age (sarcopenia) — tracking it lets you detect and reverse this early
- After any fat loss programme, SMM tells you whether you lost actual fat or destroyed muscle
Reference ranges for Indian adults (approximate):
| Group | SMM Range (Healthy) | Notes |
|---|---|---|
| Indian Men (20–39) | 28–36 kg | Higher end indicates excellent muscle development |
| Indian Men (40–59) | 26–33 kg | Preservation becomes critical from 40+ |
| Indian Men (60+) | 24–30 kg | Below 24 kg signals sarcopenia risk |
| Indian Women (20–39) | 18–24 kg | Often underestimated; critical for metabolism |
| Indian Women (40–59) | 17–22 kg | Hormonal changes accelerate muscle loss |
| Indian Women (60+) | 15–20 kg | Below 15 kg = significant functional risk |
What to do with this number: If your SMM is in the lower half of the range for your age and gender, resistance training and adequate protein (1.6–2g per kg of body weight) are your top priorities.
Section 3: Body Fat Mass (BFM) and Percent Body Fat (PBF)
Body Fat Mass (BFM) is the total kilograms of fat in your body. This includes essential fat (protecting organs, hormonal function) and excess stored fat.
Percent Body Fat (PBF) is the proportion of your body that is fat. This is the more clinically meaningful number.
India-appropriate healthy ranges:
| Group | Healthy PBF Range | Concerning Range |
|---|---|---|
| Indian Men | 15–25% | Above 28% — elevated metabolic risk |
| Indian Women | 20–32% | Above 35% — elevated metabolic risk |
Note: These ranges are slightly wider than Western references because Indian body composition norms differ. What matters more than the exact percentage is the trend over time — is PBF going down as you implement lifestyle changes?
Important distinction: The location of fat matters as much as the total. Subcutaneous fat (under the skin) is less dangerous than visceral fat (around organs). This is why the next two numbers are critical.
Section 4: Visceral Fat Level (VFL) — The Most Important Health Marker
Visceral fat surrounds your abdominal organs — liver, pancreas, intestines. Unlike subcutaneous fat (the kind you can pinch), you cannot see or feel visceral fat. It is metabolically active, releasing inflammatory compounds that directly contribute to:
- Type 2 diabetes
- Non-alcoholic fatty liver disease (NAFLD) — now affecting an estimated 30% of urban Indians
- Cardiovascular disease and arterial stiffness
- Insulin resistance
- Hormonal disruption
InBody Visceral Fat Level scale:
- 1–9: Normal range
- 10–14: Elevated — lifestyle intervention required
- 15+: High — medical attention recommended
Indians are genetically predisposed to accumulate visceral fat at lower overall body weight than most other populations. A 2011 Lancet study showed Indians have significantly higher visceral fat at any given BMI compared to Europeans. This is why an Indian at “normal” weight can still have a dangerously high VFL — and why the InBody test is particularly valuable for Indian adults.
Good news: Visceral fat responds rapidly to intervention. 8–12 weeks of consistent resistance training and a moderate calorie deficit can meaningfully reduce VFL — often before the scale moves much at all.
Section 5: Basal Metabolic Rate (BMR) — Your Resting Calorie Engine
BMR is the number of calories your body burns at complete rest — just to keep organs functioning, maintain body temperature, and support basic cellular activity.
For most Indian adults, BMR ranges from 1,200–1,800 kcal/day depending on body size and muscle mass. The critical insight: muscle mass is the primary driver of BMR. More muscle = higher BMR = more calories burned at rest 24/7.
How to use BMR for diet planning:
- Multiply your BMR by your activity factor (1.2 for sedentary, 1.55 for moderately active) to estimate Total Daily Energy Expenditure (TDEE)
- To lose fat: eat 300–500 calories below TDEE
- To build muscle: eat 200–300 calories above TDEE
- As you gain muscle over months, your BMR increases — your diet needs to be recalculated
This is why crash diets are counterproductive: severe restriction causes muscle loss, which lowers BMR, which makes future fat loss progressively harder.
Section 6: ECW/TBW Ratio — The Inflammation and Hydration Marker
This ratio compares Extracellular Water (fluid outside cells) to Total Body Water. It is one of the most medically significant markers on the report and one of the most overlooked.
What it indicates:
- Healthy range: under 0.380
- High ECW/TBW ratio (0.380+) suggests fluid is accumulating outside cells — a marker for inflammation, injury, disease, or poor cellular health
- Elevated ratio can indicate: chronic inflammation, overtraining, kidney dysfunction, liver issues, lymphoedema
- Temporarily elevated after illness, surgery, or intense unaccustomed exercise
If your ECW/TBW ratio is consistently above 0.380 without obvious cause (recent illness, intense training), discuss it with your doctor. It can be an early indicator of systemic inflammation or organ stress — often before other symptoms appear.
In clinical settings across India, this marker is increasingly used by cardiologists and endocrinologists as a routine screening tool alongside traditional blood work.
Section 7: Segmental Analysis — Where Is Your Muscle and Fat?
The segmental analysis breaks your body into five segments: right arm, left arm, trunk, right leg, left leg. For each segment, you see both muscle mass and fat mass with a bar indicating whether you are above or below average.
Why this matters:
- Muscle imbalances: A meaningful difference between right and left arm (or leg) can indicate injury compensation patterns, dominant-side overuse, or incomplete rehabilitation after a past injury
- Trunk muscle: Low trunk muscle with high trunk fat is a specific risk pattern for back pain and metabolic disease — very common in Indian desk workers
- Leg muscle: The legs hold about 50–55% of total skeletal muscle mass. Low leg muscle mass is one of the earliest markers of sarcopenia and is strongly associated with fall risk in older adults
- Rehabilitation tracking: After a knee or shoulder surgery, segmental analysis tracks whether the recovering limb is rebuilding muscle or lagging behind
Look for segments where your muscle bar is significantly below average — these are your priority training areas.
Section 8: InBody Score — The Overall Composite
The InBody Score is a composite assessment of body composition quality, combining muscle adequacy and body fat level into a single number out of 100.
- Under 60: Poor — significant body composition risk
- 60–69: Below average — improvement needed
- 70–79: Healthy range — solid foundation
- 80–89: Very good — above average body composition
- 90+: Excellent — high fitness level
For most healthy Indian adults, targeting a score of 70 or above is a realistic and meaningful goal. Scores above 80 require consistent resistance training and good nutrition habits maintained over months to years.
Use the InBody Score to track progress across retests — it gives you a single number to assess whether your overall body composition is improving, even when individual metrics are moving in different directions.
Section 9: History and Trend Graphs — Why Before/After Comparisons Matter Most
A single InBody reading gives you a snapshot. The real value comes from serial measurements over time.
Why single readings have limits:
- Body water fluctuates daily (hydration, salt intake, menstrual cycle, time of day)
- Muscle gain and fat loss happen slowly — 4–8 weeks minimum to see meaningful change
- One reading cannot distinguish real change from measurement variation
The trend graphs on your InBody report show how your SMM, PBF, body weight, and InBody Score have changed across your last several tests. This is where the story becomes visible:
- SMM going up + PBF going down = effective recomposition — keep doing what you are doing
- SMM going down + body weight going down = muscle loss diet — dangerous, adjust immediately
- SMM flat + PBF flat = no change — re-evaluate training and nutrition
- VFL decreasing even as body weight stays similar = visceral fat being replaced by muscle — excellent outcome
Recommended testing frequency: Every 6–8 weeks for active intervention. Every 3 months for maintenance monitoring.
I Got My Results. Now What? Three Common Scenarios
Scenario 1: Too Much Body Fat, Adequate Muscle
PBF above healthy range, SMM within range, VFL elevated.
- Priority: Moderate calorie deficit (300–500 kcal/day below TDEE)
- Maintain resistance training to preserve muscle during fat loss
- Add moderate cardio (2–3 sessions/week) for additional calorie burn
- Protein target: 1.6g/kg body weight minimum — non-negotiable for muscle preservation
- Retest in 8 weeks: expect 1–2% PBF reduction and VFL to drop 1–2 levels
Scenario 2: Too Little Muscle, Normal Body Fat
SMM below healthy range, PBF within range, low BMR.
- Priority: Resistance training 3–4x per week with progressive overload
- Eat at maintenance or slight surplus (100–200 kcal above TDEE) to support muscle growth
- Protein target: 1.8–2g/kg body weight
- Minimise long cardio sessions — they compete with muscle-building signals
- Retest in 8 weeks: expect SMM to increase 0.5–1kg with consistent training
Scenario 3: Good Balance — Optimise and Maintain
SMM within healthy range, PBF within healthy range, VFL below 9, InBody Score 70+.
- Priority: Maintain with 3 resistance sessions per week and adequate protein
- Progressive overload to keep improving InBody Score toward 80+
- Monitor VFL and ECW/TBW ratio — these are early warning markers even when overall composition looks good
- Retest every 3 months to catch any gradual drift
Book Your InBody Test
Understanding the numbers is one thing. Knowing your own numbers is what changes behaviour. An InBody test takes under 3 minutes and gives you a precise, data-driven picture of your body composition — the same technology used by hospitals, sports teams, and research institutions across India.
Find Your Nearest InBody Test Centre
Over 1,800 InBody-equipped centres across India — in hospitals, gyms, diagnostic centres, and wellness clinics. Walk in, test, and walk out with a complete picture of your body composition.
Related Reads
- “Visceral Fat Normal Range India: The Number That Predicts Disease Before Symptoms”
- “Sarcopenia in India: Why Indians Lose Muscle 30% Faster After 35”
- “Body Composition vs BMI: Why Indians Get It Wrong”

Most trending articles

Healthy Body Composition by Age for Indians: Reference Ranges at 20s, 30s, 40s, 50s+
Body composition reference ranges for Indian men and women by age. Find out if your body fat %, muscle mass, and visceral fat level are healthy for your age and what to do if they're not.

Metabolic Age Explained: What It Reveals About Your Real Health (And How to Lower It)
Metabolic age vs chronological age. What it means, why many Indians in their 30s have the metabolism of a 50-year-old, and 5 evidence-based steps to reverse metabolic aging.

InBody vs DEXA Scan vs Caliper: Which Body Fat Test Is Right for You in India?
Compare InBody, DEXA scan, and caliper tests for body fat measurement. Accuracy, cost in India, availability, and which gives you the most actionable data for your goals.