
Health 11 min read
South Indian vs North Indian Diet: What Body Composition Data Actually Shows (Not Which One to Abandon)
Trivandrum's diabetes rate is 28% vs Delhi's 18%, but rice isn't why. Real macro data on regional Indian diets, and how to optimise yours, not abandon it.
Reading about body composition? Find an InBody test centre near you →
South Indian vs North Indian Diet: What Body Composition Data Actually Shows
“Cut the carbs.” “Eat clean.” “Rice is basically sugar.” If you have gone looking for diet advice to improve your body composition in India, you have almost certainly run into some version of this — generic, usually written for a Western reader, and blind to the fact that a South Indian diet built around rice, sambar, and coconut is not a mistake waiting to be corrected. It is a food culture, refined over centuries, feeding hundreds of millions of people every single day. The same is true of a North Indian diet built around wheat, dal, ghee, and paneer. Neither is a problem to be “fixed” by abandoning it for a generic clean-eating template.
But regional dietary patterns do not behave identically inside the body. Published Indian nutrition research — including a 2025 nationwide analysis from the Indian Council of Medical Research (ICMR) and a large cross-sectional study spanning Delhi, Mumbai, and Trivandrum — shows measurable differences in how rice-centred and wheat-centred eating patterns relate to protein intake, carbohydrate load, and metabolic risk. This article walks through what that data actually says, and, more usefully, how to use it to optimise the diet you already eat rather than replace it.
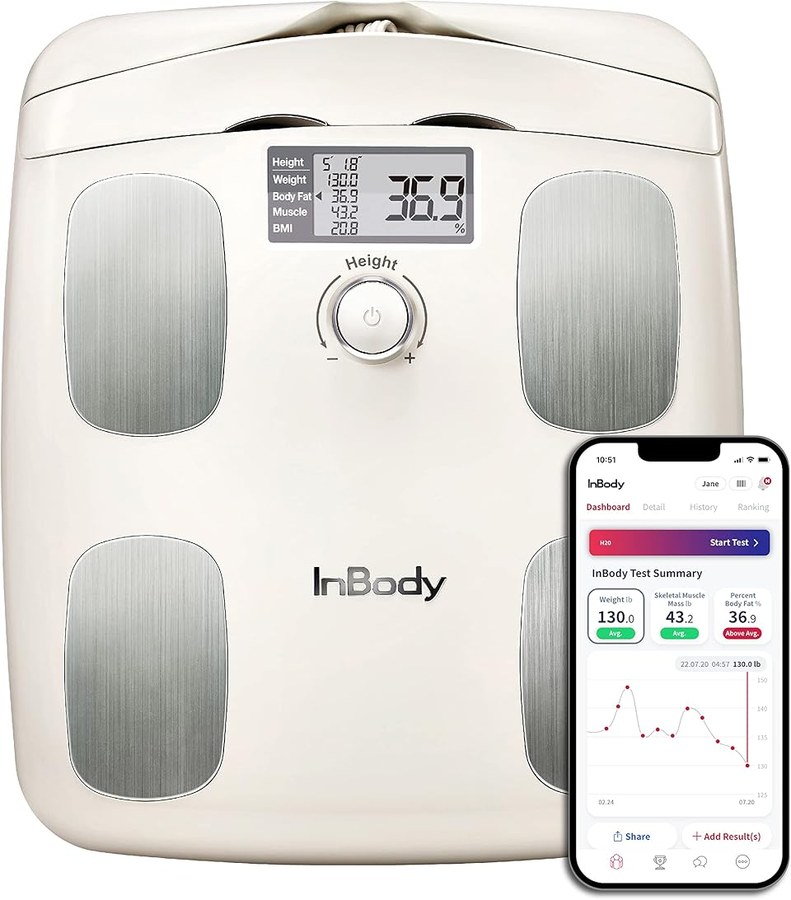
Beyond North vs South: India’s Diet Map Is Far More Textured Than a Binary
Before going further, a necessary caveat: “South Indian diet” and “North Indian diet” are broad generalisations, and treating them as the only two food cultures in India would be inaccurate and, frankly, a little insulting to the country’s actual culinary diversity. A Bengali thali built around fish and rice looks nothing like a Gujarati thali built around dhokla, khichdi, and jaggery-tempered dal. A Kerala meal centred on coconut, rice, and fish differs sharply from a Punjabi meal centred on wheat, dairy, and legumes. Northeastern cuisines — Naga, Khasi, Manipuri — rely on fermented foods, pork, and rice in ways that resemble neither pattern discussed here.
The data on vegetarianism alone makes the point. National Family Health Survey (NFHS-5) data shows Punjab, Haryana, and Rajasthan are the only states with a vegetarian majority — Haryana alone has close to 80% of women and more than 56% of men reporting they never eat meat. At the other end, Assam, West Bengal, and Kerala each report fewer than 5% vegetarians, and most Northeastern states sit below 2%. The staple grain itself varies by pocket too: jowar (sorghum) anchors Maharashtra and northern Karnataka (Maharashtra alone grows roughly 38% of India’s jowar), ragi (finger millet) is Karnataka’s signature grain, and bajra (pearl millet) anchors meals across Rajasthan, Gujarat, and Haryana. None of this fits neatly into “rice states” and “wheat states.”
So why does this article still focus on the broad rice-heavy and wheat-heavy patterns loosely mapped to South and North India? Practicality. They are the two most searched, most widely recognised dietary patterns in India, they cover the largest share of the population by staple carbohydrate, and the available research — including the studies cited below — is largely structured around exactly this comparison. Treat everything that follows as a starting framework, not a verdict on your specific regional cuisine.
The Macro Comparison: What Rice-Heavy and Wheat-Ghee-Heavy Meals Actually Deliver
Start with the staple foods themselves. A typical South Indian breakfast of idli and dosa, and a typical North Indian meal built around roti, dal, and ghee, carry genuinely different nutrient profiles per serving.
| Food | Typical serving | Calories | Protein | Carbs | Fat |
|---|---|---|---|---|---|
| Idli (1 piece) | ~30g | ~58–61 kcal | ~2.3g | ~12g | ~0.2g |
| Dosa (plain, 1 piece) | ~medium | ~120 kcal | ~2g | ~17g | ~3g |
| Sambar (1 cup) | ~250g | ~130–150 kcal | ~5–6g | ~20g | ~3–5g |
| Roti/chapati (1 medium) | ~40g | ~120 kcal | ~3.2g | ~23g | ~2g |
| Ghee (1 tbsp) | ~14g | ~120–130 kcal | 0g | 0g | ~14g (≈8g saturated) |
| Paneer (100g) | ~100g | ~296–321 kcal | ~18–22g | ~3–4g | ~22–25g |
| Plain dahi/curd (100g) | ~100g | ~62 kcal | ~3.5g | ~5g | ~3.5g |
| Cooked toor/moong dal (100g) | ~100g | ~100–120 kcal | ~7.5–9g | ~18–20g | ~0.4g |
Three patterns emerge that matter for body composition. First, rice-based South Indian staples (idli, dosa) are individually low in protein relative to their carbohydrate content — three idlis with sambar delivers roughly 250–300 calories but only around 12–15g of protein unless the sambar portion is generous. Second, the North Indian ghee-and-paneer combination front-loads saturated fat: one tablespoon of ghee alone carries about 8g of saturated fat, around 62% of its total fat content, per USDA-sourced nutrition data. Third, dal — whether as sambar or as a North Indian preparation like rajma or chana — shows up in both diets and consistently under-delivers on protein relative to how central it is to the plate.
Glycemic load compounds this. White rice carries a glycemic index of roughly 72–73, at the high end of the scale, while whole wheat roti sits lower, in the roughly 60–70 range depending on flour and cooking method. There is a popular claim that fermentation drops idli and dosa into “low-GI” territory — the published research is murkier than that. Some studies report a medium glycemic index for standard idli; others measure it considerably higher depending on rice variety and fermentation time. The fermentation effect is real but smaller and less consistent than the myth suggests. The safer takeaway: idli and dosa are still fundamentally rice, and a rice-centred plate carries a higher glycemic load per gram of carbohydrate than a wheat-centred one, unless deliberately balanced with protein and fibre.
On the national scale, this carbohydrate-heavy, protein-light pattern is not a South-only issue — it is an India-wide one. A large 2025 ICMR analysis (ICMR–INDIAB survey-21, published in Nature Medicine) found that Indians derive approximately 62% of daily calories from carbohydrates — rice, wheat, and sugar combined — while average protein intake sits at just around 12% of total energy, “significantly below protective levels” according to the researchers. The same analysis flagged Kerala as having the lowest plant-protein contribution of any state, at just 5.7% of total energy, and noted that Southern states in particular showed elevated saturated fat intake, driven by coconut oil and subsidised palm oil, alongside heavy reliance on white rice with comparatively little pulses and protein diversity. The researchers estimated that this pattern of low-quality carbohydrates is associated with 14–30% higher cardiometabolic risk — a risk that is meaningfully reduced when carbohydrate calories are swapped for protein calories, not necessarily when carbohydrates are eliminated altogether.

What This Actually Means Depends on What You Eat — Optimising Within Your Own Pattern
The point of this data is not to declare one regional diet “better.” It is to show where the specific leverage points sit inside each pattern.
If your plate is rice-centred (South Indian, Bengali, or otherwise)
The single highest-leverage change is not switching to rotis — it is protein-pairing. Sambar already contributes a real, if modest, amount of protein (roughly 5–6g per cup from toor dal), but most rice-and-sambar meals stay carbohydrate-dominant. Adding a boiled egg, 50–100g of paneer, or a katori of thick curd can add 8–15g of protein without changing the meal’s identity. A second lever is the rice itself: parboiled rice (used for idli and dosa batter, and eaten directly in several southern households) has a lower glycemic index than fully polished white rice because parboiling increases resistant starch. Choosing parboiled over polished rice, or simply reducing the rice portion by a third while increasing sambar and vegetables, moves the meal’s glycemic load down without giving up rice. A third and arguably more important lever: risk in rice-heavy regions tracks far more strongly with sweets-and-snacks eating than with rice itself — so the highest-value swap may not involve rice at all, but what replaces the evening vada or biscuit.
If your plate is wheat-and-ghee-centred (North Indian, Punjabi, or otherwise)
Here the leverage points sit in fat moderation and protein sourcing, not carbohydrate elimination. Ghee is not the enemy — it carries fat-soluble vitamins and is deeply embedded in how North Indian food is cooked — but portion awareness matters given that one tablespoon delivers close to 8g of saturated fat. Measuring rather than eyeballing ghee (a level teaspoon per roti, not a generous pour) is a realistic, culturally-compatible adjustment. On the protein side, paneer (roughly 18–22g protein per 100g) and dal are already present in most North Indian meals; the gap is usually quantity, not absence — a bigger dal portion, a katori of curd at every meal, or atta rotis over refined maida closes it without restructuring the plate. Swapping some rice or roti for millet-based flatbreads — bajra roti, jowar bhakri, already common across Rajasthan, Gujarat, and Haryana — is another India-native way to add fibre and slow glucose absorption.
Why Testing Beats Switching Diets Entirely
Here is where the regional-diet research gets genuinely useful. The Delhi–Mumbai–Trivandrum cross-sectional study, which assessed 3,814 adults for dietary pattern and cardiometabolic risk, found that in Trivandrum specifically, the traditional “pulses-and-rice” pattern was inversely associated with diabetes (odds ratio 0.70, highest vs. lowest adherence group) — people eating more of the rice-and-pulses combination had lower, not higher, diabetes risk. What was positively associated with abdominal adiposity in the same city was a “sweets-and-snacks” pattern (odds ratio 2.05). Diabetes prevalence in Trivandrum was measured at 28%, against 18% in Delhi and 10% in Mumbai — a striking gap, but one researchers link to eating patterns layered on top of the rice staple, not to rice consumption on its own.
This is precisely why a body composition test is a better instrument than a generic diet overhaul. Blanket advice to “quit rice” or “quit ghee” ignores that the variable actually driving risk above is what displaces the traditional staple pattern — snacks, sweets, refined carbohydrate creep — not the staple itself. A body composition test measures Skeletal Muscle Mass (SMM), Percent Body Fat (PBF), and Visceral Fat Area (VFA) directly, so you can make one targeted change within your own food culture — adding curd to lunch, swapping polished rice for parboiled, measuring your ghee — and retest in 8–12 weeks to see whether VFA and PBF actually moved while SMM held steady. That is a far more precise feedback loop than assuming an entire regional cuisine needs abandoning. Two people eating very different regional diets can both be optimising well, or both under-optimised — the only way to know is to measure the body, not judge the plate.
Frequently Asked Questions
Is a South Indian rice-based diet worse for body composition than a North Indian wheat-based diet?
Not inherently. Research on regional dietary patterns shows that traditional rice-and-pulses eating in South India is actually associated with lower diabetes risk when compared within the same population, while sweets-and-snacks eating carries the higher risk. The issue is less “rice vs wheat” and more how much protein and fibre accompany the staple carbohydrate at each meal.
Should South Indians stop eating rice to improve body composition?
No — the data does not support elimination. It supports adjustment: choosing parboiled over polished rice, moderating portion size, and pairing rice with more protein (egg, paneer, curd, extra dal) at each meal. A body composition test can show whether these smaller changes are moving your Percent Body Fat and Visceral Fat Area in the right direction without you having to give up rice entirely.
Is ghee bad for fat loss or body composition?
Ghee is calorie-dense and saturated-fat-heavy — about 8g of saturated fat per tablespoon — so portion matters more than elimination. Used in measured amounts (roughly a teaspoon per roti rather than a generous pour), it fits within most fat-loss or recomposition plans. The bigger lever in ghee-heavy diets is usually protein sufficiency, not the ghee itself.
How much protein does a typical South Indian meal of idli or dosa with sambar provide?
A serving of 2–3 idlis with a cup of sambar delivers roughly 12–15g of protein, mostly from the toor dal in sambar. That is well below what most adults need per meal for muscle maintenance. Adding an egg, 50–100g of paneer, or a bowl of thick curd can raise this to 20–25g without changing the meal.
Does fermentation make idli and dosa low glycemic index foods?
Only partially, and the research is more mixed than popular belief suggests. Fermentation does slow starch digestion somewhat, but published glycemic index values for idli range from medium to notably high depending on rice variety and fermentation time. Idli and dosa are still primarily rice-based, so pairing them with protein and vegetables matters more than relying on fermentation alone to blunt the glycemic response.
Which regional Indian diet is healthiest for weight loss?
No single regional diet is universally “healthiest” — India’s dietary map includes far more than a North-South binary, from Bengali fish-and-rice to Gujarati millet-and-legume patterns to Kerala’s coconut-rice-fish cuisine. What predicts better body composition outcomes across regions is adequate protein per meal, controlled portions of the staple carbohydrate, and minimal reliance on processed snacks and sweets — achievable within any regional food culture.
How can I tell if my regional diet is actually working for my body composition?
The scale cannot tell you this — it does not distinguish fat loss from muscle loss or water shifts. A body composition test measures Skeletal Muscle Mass, Percent Body Fat, and Visceral Fat Area directly. Testing before making dietary tweaks and again 8–12 weeks later shows precisely whether changes like adding protein to your rice meals or moderating ghee are producing real fat loss with preserved muscle.
Your regional diet is not the problem to be solved — how well it is optimised for your individual body is. Get an InBody body composition test to see your exact Skeletal Muscle Mass, Percent Body Fat, and Visceral Fat Area, then make one targeted change within your own food culture and retest to see what actually moved. Find out what an InBody test involves and book yours here.
Related reading: vegetarian muscle-building strategies using dal, paneer, and soy, what happens to your body composition on a keto diet in India, and a complete guide to choosing protein powder in India.
