
Health 15 min read
India’s Sugar Problem: How Chai, Mithai, and Hidden Sugar Are Destroying Your Visceral Fat Numbers
The average Indian consumes 19 teaspoons of sugar daily — 3x the WHO recommendation. How added sugar drives visceral fat storage specifically, and the 8-week body composition transformation when you cut it.
Reading about body composition? Find an InBody test centre near you →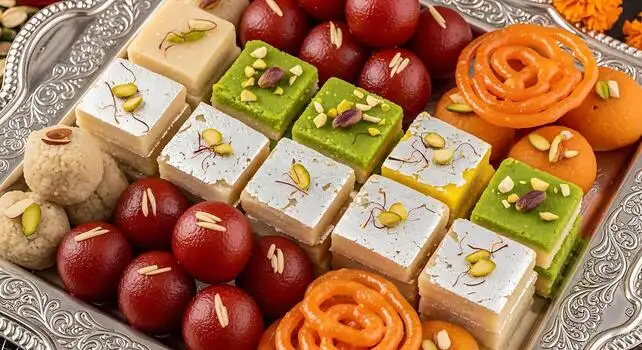
India’s Sugar Crisis Is Silent — And Your Visceral Fat Is Paying the Price
India has a complicated relationship with sugar. It is woven into hospitality, religion, celebration, and daily ritual in ways that make it almost impossible to separate from culture itself. A guest arrives — you offer something sweet. A festival arrives — mithai is exchanged by the kilogram. A workday begins — tea is made, and it is sweet. This is not a character flaw. It is culture. But it is also, measurably, one of the most significant drivers of visceral fat accumulation in the Indian population — and the data is alarming.
India is now the world’s second-largest diabetic population, with approximately 77 million people living with diabetes according to the IDF Diabetes Atlas 2021 — second only to China. More sobering is what lies beneath that number: an estimated 57 million Indians have prediabetes without knowing it. The metabolic collapse that ends in diabetes does not happen overnight. It happens over years of subclinical visceral fat accumulation, driven in large part by one molecule: fructose.
This article is not about demonising sugar in broad strokes. It is about understanding exactly how sugar — particularly the kind hidden in everyday Indian foods — affects body composition at the biochemical level, why Indians are disproportionately vulnerable, and what measurable changes happen when you actually cut it.

How Much Sugar Is India Actually Consuming?
India’s per capita sugar consumption sits at approximately 19–20 kg per person per year, and that figure only captures sucrose from formal supply chains. It does not account for jaggery, honey, glucose powder, or the sugar embedded in packaged foods sold without clear labelling. When all forms are included, the real number is considerably higher in urban populations.
To make this concrete: consider the average urban Indian’s chai habit. Four to five cups of tea per day is not unusual — many Indians would call that conservative. Each cup typically contains 1.5 to 2 teaspoons of sugar. At two teaspoons per cup, five cups per day delivers 50 grams of added sugar from chai alone. The World Health Organisation recommends a maximum of 25 grams of free sugars per day for adults. Chai, by itself, doubles that recommendation before breakfast has been eaten.
Layer on top of that the cultural architecture of sugar consumption: prasad at the temple in the morning, mithai boxes circulating at the office during Diwali season, sweetened lassi at lunch, a Bournvita or Horlicks drink in the evening, perhaps a Marie biscuit or two — and the daily sugar load for a middle-class urban Indian can easily reach 80–120 grams per day. This is not an exaggeration. This is the default pattern for tens of millions of people.
The Hidden Sugar Map of “Healthy” Indian Foods
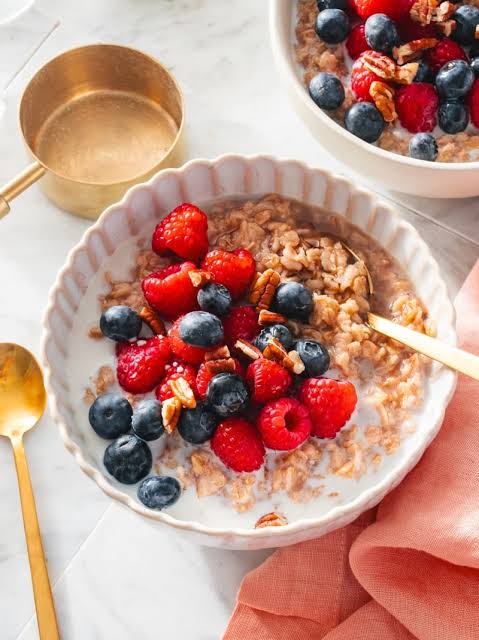
The most dangerous sugar is the sugar you do not think you are eating. Indian food marketing has been particularly effective at creating a category of products that feel virtuous — the biscuit your mother bought because it had “atta” on the label, the flavoured dahi your child loves because it says “probiotic,” the packet of flavoured oats you eat because it says “heart healthy.”
The reality, when you read the nutrition labels:
- Bournvita (30g serving): Approximately 19–20g of sugar per serving. The product is marketed as a nutritional supplement for children. It is, nutritionally, closer to a confection with added vitamins.
- Horlicks (standard serving): Around 8–10g of sugar per serving, with maltodextrin as a primary ingredient — a high-glycaemic carbohydrate that raises blood glucose as fast as pure sugar.
- Packaged flavoured dahi (100g serving): Many popular brands carry 12–16g of added sugar. Regular plain dahi has zero added sugar. The packaging difference can be subtle.
- Packaged fruit juice (“100% natural”): A 200ml serving of packaged mango or mixed fruit juice typically contains 22–28g of sugar, with essentially zero fibre. The fibre matrix that slows fructose absorption in whole fruit is destroyed during processing.
- Rooh Afza (30ml serving): Approximately 23g of sugar — nearly a full day’s recommended intake in a small pour. During Ramzan or summers, consumption can run to multiple servings a day.
- Granola bars and flavoured oats packets: A single serving of many popular Indian granola bars contains 10–14g of sugar. Flavoured oats packets (masala, sweet variants) often contain maltodextrin, sugar, and glucose syrup as the primary flavouring vehicles.
- Digestive Marie biscuits: Not as innocent as they sound. A serving of four biscuits can deliver 8–10g of sugar, plus refined flour that metabolises rapidly. The “digestive” branding is a marketing term, not a clinical one.
The pattern is consistent: foods positioned as healthy options for children, athletes, or health-conscious adults are frequently high in added sugars, often disguised under names like dextrose, maltodextrin, invert sugar, corn syrup solids, evaporated cane juice, or glucose-fructose syrup. Sugar has over 50 recognised aliases in ingredient lists. Food manufacturers use multiple forms in a single product specifically so no single sugar source appears early in the ingredient order.
The Biochemistry: Why Fructose Goes Straight to Visceral Fat
Table sugar — sucrose — is a 50/50 molecule: half glucose, half fructose. This matters enormously because glucose and fructose are metabolised through completely different pathways, with radically different consequences for body composition.
Glucose is metabolised by every cell in the body. It triggers insulin release, which signals satiety through leptin pathways. Excess glucose can be stored as glycogen in muscle and liver, and only spills over into fat synthesis when glycogen stores are full.
Fructose is processed almost exclusively in the liver. It does not trigger insulin release. It does not stimulate leptin — the hormone that signals fullness. This means fructose delivers calories without triggering satiety signals, which is one reason high-fructose diets are associated with overconsumption. More critically, when the liver receives a large fructose load, it converts it directly into triglycerides through a process called de novo lipogenesis. These triglycerides are not distributed to subcutaneous fat depots the way dietary fat tends to be. They accumulate preferentially as visceral fat — the metabolically active fat packed around the liver, pancreas, and intestines — and as hepatic fat, which is the precursor to non-alcoholic fatty liver disease.
This is the critical distinction that most people miss: sugar is more dangerous for visceral fat accumulation than equivalent calories from dietary fat or complex carbohydrates. A high-fat diet may raise subcutaneous fat — fat you can see and pinch. A high-fructose diet raises visceral fat — fat that is invisible on the scale and in the mirror, but is directly implicated in insulin resistance, cardiovascular disease, and metabolic syndrome.
Research published in journals including the Journal of Clinical Endocrinology & Metabolism has demonstrated that isocaloric substitution of glucose with fructose in controlled settings produces significantly greater visceral fat deposition. The liver-VFA axis is not theoretical — it is mechanistic and well-documented.
Why Indians Are Specifically Vulnerable
Indian bodies respond to sugar and carbohydrate loads differently than Western populations, and the data on this is robust. Indians demonstrate a genetic predisposition to higher insulin resistance at lower BMI thresholds — a phenomenon sometimes called the “thin-fat Indian” phenotype, characterised by relatively low muscle mass and disproportionately high body fat percentage, including visceral fat, even at body weights that appear healthy by Western BMI standards.
A landmark study on Asian Indians found that at equivalent BMI values, Indians carry significantly more visceral fat than Caucasians. This means the BMI thresholds used to define overweight and obesity in Western populations underestimate metabolic risk in Indians. An Indian at BMI 23 may already have a visceral fat profile that would be considered high-risk.
This genetic background — combined with a traditionally high-carbohydrate diet (rice, roti, pulses form the caloric backbone of most Indian meals), a high-sugar cultural overlay, and increasingly sedentary urban lifestyles — creates the conditions for accelerated visceral fat accumulation at ages that would not trigger concern in Western clinical practice. It is not unusual to see significant visceral fat accumulation in Indian men in their late twenties and women in their mid-thirties.
What InBody Analysis Reveals in High-Sugar Consumers
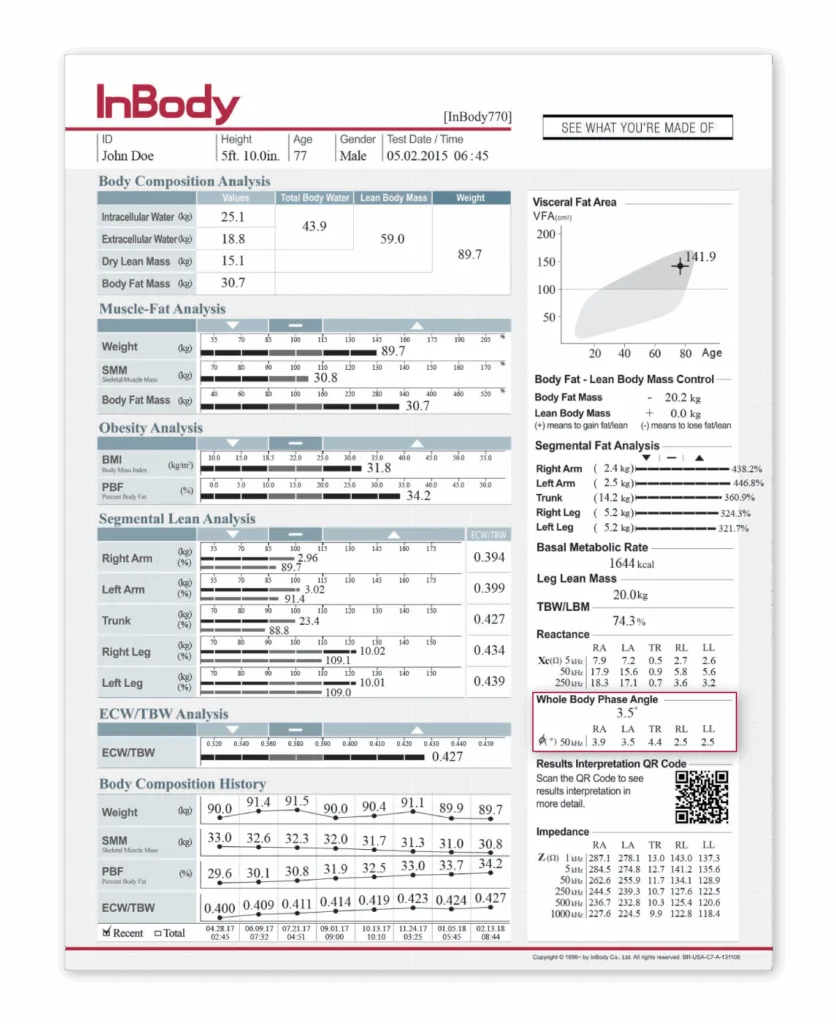
The scale is a singularly poor diagnostic tool for metabolic health. A person can be at a perfectly average weight by BMI and be metabolically compromised — and this pattern is particularly common in India. Body composition analysis using InBody technology makes the invisible visible.
In individuals with high habitual sugar intake, InBody analysis consistently shows a characteristic pattern:
- Elevated Visceral Fat Area (VFA): The InBody assessment measures visceral fat in square centimetres. A VFA above 100 cm² is considered high risk for metabolic disease. Many urban Indian adults — including individuals at normal or near-normal body weight — present with VFA readings in the 120–160 cm² range. These are individuals who may never have been told by a bathroom scale or a BMI chart that they have a problem.
- Elevated ECW/TBW Ratio: The ratio of extracellular water to total body water is an InBody marker for systemic inflammation and fluid distribution abnormality. Chronic high sugar intake drives low-grade inflammation — elevated insulin, glycation end-products, and inflammatory cytokines from visceral fat tissue all shift this ratio upward. A healthy ECW/TBW ratio sits below 0.380. Values at or above this threshold often correlate with metabolic stress that is not yet visible in standard blood panels.
- Higher PBF Than Expected: Percent Body Fat often reads higher than individuals expect given their visible physique. This is the thin-fat pattern — adequate or low total body weight, but low Skeletal Muscle Mass (SMM) and higher-than-appropriate fat mass. Sugar consumption accelerates this by promoting fat storage (particularly visceral) while doing little to preserve or build muscle. Low SMM also means lower insulin sensitivity in muscle tissue, which further compounds the metabolic effect of sugar.
- Low InBody Score Despite Normal Appearance: The composite InBody Score reflects the balance between muscle and fat relative to body weight norms. High-sugar diets that suppress muscle protein synthesis and promote fat gain tend to drive this score down even in individuals who appear lean.
Reading Indian Food Labels: The Hidden Sugar Audit
Sugar is listed on Indian nutrition labels under the “Carbohydrates” section as a sub-category. The law requires this — but it does not require clarity about added sugars versus naturally occurring sugars. This creates deliberate ambiguity. A product with 15g of “sugars” per serving may be naturally sweet from fruit, or it may have 14g of added sugar and 1g from the base ingredient.
To identify hidden sugars in Indian packaged foods:
- Read the ingredients list, not just the nutrition panel. Ingredients are listed in descending order of weight. If any form of sugar appears in the first three ingredients, the product is high in sugar regardless of how the product is positioned.
- Know the aliases: sucrose, glucose, dextrose, fructose, maltose, lactose, corn syrup, high-fructose corn syrup, maltodextrin, dextrin, invert sugar, invert syrup, evaporated cane juice, cane syrup, raw sugar, brown sugar, fruit juice concentrate, honey, agave nectar, molasses, treacle, barley malt, rice syrup.
- Watch for the “per serving” deception. A biscuit packet may list nutrition per 2 biscuits when the realistic serving is 6–8. A health drink may list per 15g when the scoop provided is 30g. Always multiply accordingly.
- Products with more than 5g of sugar per 100g warrant scrutiny for added sugar content in the context of a reduced-sugar diet.
Practical Sugar Reduction for Indians: A Realistic Framework
Chai — The Biggest Lever
For most Indians, chai is the single largest source of added sugar in the daily diet. Cold-turkey reduction rarely works — tea brewed without sugar tastes genuinely unpleasant to someone accustomed to sweetened chai, and the palatability gap causes most attempts to fail within days.
The approach that works is a gradual step-down: reduce by half a teaspoon per cup every two weeks. The palate adapts with almost no conscious discomfort over 6–8 weeks. Someone who currently takes two teaspoons per cup can reach half a teaspoon — or none — without ever experiencing tea that tastes wrong.
On jaggery as a chai sweetener: jaggery does contain trace minerals absent from refined sugar, but its glycaemic index is only marginally lower than sucrose and it is still predominantly sucrose and glucose. Switching from sugar to jaggery is not a metabolic intervention. It is a lateral move. If you prefer jaggery for cultural or taste reasons, use it — but do not use the switch as a reason to maintain the same volume of sweetener.
On stevia: the evidence is genuinely positive. Stevia does not raise blood glucose, does not trigger insulin response, and controlled studies show that stevia substitution for sugar is associated with measurable reductions in body fat percentage over time. The bitterness aftertaste that some people experience with early stevia products has been significantly reduced in newer formulations.
Mithai and Cultural Occasions
Refusing mithai at a wedding or during Diwali is, in most Indian social contexts, not a realistic option. The goal is not elimination — it is portion architecture. Take one piece. Eat it slowly, actually tasting it. Decline the second serving with a genuine expression of enjoyment rather than a refusal. This is socially much easier and metabolically far more significant than eating three pieces out of social pressure.
At home, dry fruit-based sweets — dates-and-nut ladoos, almond barfi made without refined sugar — satisfy the cultural need for something sweet while delivering fibre, fat, and minerals that slow glucose absorption and reduce the fructose hit. These are not diet food. They are simply better-composed sweet foods.
Packaged Foods and Drinks
Bournvita, Horlicks, and similar health drinks should be treated as occasional treats, not daily nutrition. Plain milk with a small amount of real cocoa powder (unsweetened) and a half teaspoon of jaggery delivers protein and minerals without the sugar load.
Replace flavoured dahi with plain dahi. Add fresh fruit or a teaspoon of honey if needed — but you will consume a fraction of the sugar in the commercial flavoured version. Replace packaged fruit juice with whole fruit. A whole orange gives you the same fructose as a small glass of juice, plus 3–4g of fibre that dramatically slows absorption and engages satiety hormones. The glucose response curve is genuinely, measurably different.
Priority Order for Sugar Reduction
Not all sugar sources are equal in their contribution to your VFA. Prioritise eliminating the sources that deliver the most sugar most frequently: liquid sugars first (chai, juice, flavoured drinks), then daily packaged snacks, then occasional mithai. Fixing chai alone can remove 40–60g of added sugar from the daily total — a transformation that will show up on InBody within weeks.
What Happens to Your InBody Numbers in 8 Weeks
When significant sugar restriction is implemented — reducing to under 25g of added sugar per day from a baseline of 80–100g — the body composition changes that follow are not primarily about total weight. Studies on sugar restriction consistently show visceral fat reductions of 10–15% within 8 weeks, even without dramatic changes in total caloric intake.
A person who begins at VFA 140 cm² may measure VFA 118–126 cm² after eight weeks of sugar reduction. The scale may show very little change — perhaps 1–2 kg at most, sometimes less. This is the critical point: the scale is the wrong measuring instrument for this intervention.
Visceral fat is not the heaviest tissue in your body. Dropping 10–15% of your VFA does not move the needle on a bathroom scale in any meaningful way. But it moves the needle on insulin sensitivity, inflammatory markers, liver enzyme levels, and long-term cardiovascular risk in ways that are clinically significant.
InBody analysis at baseline and at eight weeks will show what the scale cannot: a measurable reduction in VFA, a shift in ECW/TBW ratio toward the healthy range as inflammation subsides, and — particularly if the sugar reduction is accompanied by even modest increases in protein intake and physical activity — improved SMM and InBody Score.
The ECW/TBW improvement is particularly notable. Chronic sugar-driven inflammation produces fluid retention in extracellular compartments. As sugar drops, inflammatory burden decreases, and the fluid balance normalises — a change InBody captures with precision.
The Scale Lies. Body Composition Analysis Doesn’t.
This is perhaps the most important practical insight in this entire article. If you are cutting sugar and checking only your bathroom scale, you will frequently be disappointed and abandon the intervention. The weight loss, particularly in the first few weeks, may be modest. But the metabolic transformation happening beneath the surface — visceral fat reduction, inflammation reduction, insulin sensitivity improvement — is real, measurable, and clinically significant.
The only tool that captures this transformation accurately is body composition analysis. InBody technology measures VFA directly, tracks ECW/TBW ratio as an inflammation proxy, and separates fat mass from muscle mass so you can see exactly what is changing and where. This is not an academic distinction. It is the difference between seeing evidence of progress and abandoning an intervention that is actually working.
India’s sugar problem is structural, cultural, and deeply embedded. But it is not inevitable. The biochemistry is clear. The intervention is practical. The results are measurable — not on a scale, but on a body composition report that shows your visceral fat in square centimetres, your inflammation status in a ratio, and your metabolic trajectory in numbers that actually mean something.
Get Your Visceral Fat Numbers Tested
The first step in reducing visceral fat is knowing where you actually stand. Most people significantly underestimate their VFA — and significantly overestimate how well their weight reflects their metabolic health. An InBody assessment gives you a precise baseline: your VFA, your PBF, your SMM, your ECW/TBW ratio, and your InBody Score — all measured in minutes, non-invasively.
Once you have a baseline, reducing sugar is no longer a vague act of willpower. It is a targeted intervention with a measurable outcome. You can retest at eight weeks and see exactly what changed — not on the scale, but in the numbers that actually predict your metabolic future.
Find an InBody-certified testing centre near you and get your body composition assessed. The number that matters most is the one most people have never seen — their VFA. Locate an InBody testing centre in India here.
Related:
Visceral Fat: Normal Range, Risks & How to Measure It |
Find an InBody Test Centre Near You
Frequently Asked Questions
How much sugar does the average Indian actually consume?
Studies estimate the average Indian consumes around 19 teaspoons of sugar daily through tea, sweets, and hidden sources in packaged food — roughly three times the WHO's recommended limit.
Does sugar specifically increase visceral fat?
Yes — excess fructose and refined sugar are preferentially metabolized by the liver into fat, and research links high sugar intake specifically to visceral and liver fat accumulation more than other fat depots.
How quickly can visceral fat drop after cutting sugar?
Body composition tracking shows measurable visceral fat reductions within 8 weeks for many people who significantly cut added sugar, particularly from tea and packaged snacks, while keeping other habits stable.
