India has 41 million children living with overweight or obesity. On World Obesity Day 2026, the World Obesity Federation confirmed what clinicians across the country have been seeing for years: India now ranks second in the world — behind only China — in total childhood obesity burden. Yet most of these children will never be flagged by a standard growth chart. Most parents see a healthy, well-fed child. And most clinicians, relying on BMI alone, will miss the visceral fat, skeletal muscle deficit, and metabolic risk hiding behind a “normal” number.
In this article, we examine the seven root causes driving India’s childhood obesity crisis — and explain why body composition analysis, not BMI, is the only tool that can reliably detect it in your outpatient department today.
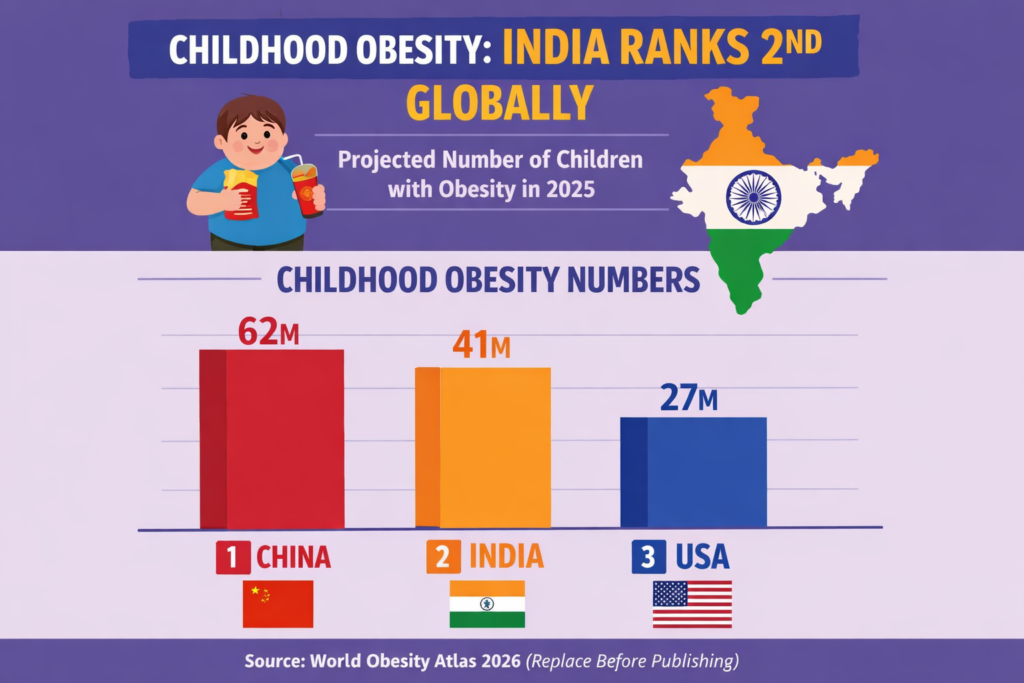
| 41 Million Indian children (5–19 yrs) overweight or obese in 2025 | #2 Globally India’s rank — behind only China (62M) | 5% / year Annual growth rate of childhood obesity in India | 56 Million Projected affected Indian children by 2040 |
Why India? Understanding the Scale of the Crisis
The World Obesity Atlas 2026 — released on World Obesity Day, March 4, 2026 — confirmed that approximately 41 million Indian children aged 5–19 are living with overweight or obesity. Of these, 14 million are classified as living with obesity specifically. India sits second only to China (62 million) and well ahead of the United States (27 million).
What makes India’s position especially alarming is the rate of acceleration. Childhood obesity in India is growing at approximately 5% per year — one of the fastest growth rates globally. Without intervention, the World Obesity Atlas 2026 projects 56 million overweight and obese Indian children by 2040. That brings with it a projected surge in paediatric hypertension, hyperglycaemia, and metabolic liver disease that no health system in the country is currently equipped to absorb.
BY 2040, WITHOUT INTERVENTION
BMI-related hypertension in Indian children will rise from 2.99 million → 4.21 million cases. Hyperglycaemia will increase from 1.39 million → 1.91 million. High triglycerides will jump from 4.39 million → 6.07 million.
Source: World Obesity Atlas 2026.
Reason 1 — The Rapid Urbanisation–Diet Transition Trap
India’s economic growth has transformed the dietary landscape — but not in a healthy direction. Ultra-processed food (UPF) consumption surged from USD 900 million in 2006 to USD 37.9 billion in 2019, a growth rate of over 33% annually, per India’s Economic Survey 2024–25. Retail sales of ultra-processed foods grew at a CAGR of 13.7% between 2011 and 2021.
The shift from traditional fibre-rich diets to calorie-dense, nutrient-poor packaged foods is particularly damaging in children aged 6–15, whose metabolic programming is still active. The ICMR-NIN 2024 report identified unhealthy diets as the leading contributor to India’s total disease burden, accounting for 56% of it. Furthermore, aggressive marketing of energy-dense snacks directly targets children aged 6–14 across India’s top digital and broadcast channels.
CLINICAL IMPLICATION
Children from urban semi-affluent households warrant early metabolic screening regardless of BMI percentile. Visceral adiposity in Indian children accumulates at lower BMI thresholds than Western counterparts. InBody body composition analysis is the only tool that detects this in the consultation room — in under 60 seconds.
Reason 2 — Catastrophically Low Physical Activity Levels
The World Obesity Atlas 2026 reports that 74% of Indian adolescents aged 11–17 fail to meet the WHO-recommended minimum of 60 minutes of moderate-to-vigorous physical activity per day. This is among the highest rates of youth physical inactivity globally.
The causes are layered: academic pressure compressing recreational time, the explosion of screen-based entertainment replacing outdoor play, urban infrastructure lacking safe outdoor spaces, and cultural norms deprioritising physical activity — particularly for girls. Sedentary behaviour during childhood disrupts not just caloric balance but also the development of healthy insulin sensitivity, skeletal muscle mass, and basal metabolic rate.
This creates the metabolic phenotype clinicians increasingly encounter in Indian practice: ‘normal weight obesity’ — the thin-fat syndrome. A child presenting at BMI 19 kg/m² may carry clinically significant visceral fat, elevated liver enzymes, and skeletal muscle mass well below population norm. BMI will not flag any of this.
The ‘Thin-Fat Indian Child’ Paradox
Research from multiple IAP studies confirms that Indian children display higher body fat percentage at lower BMI values compared to Western norms. A child at 19 kg/m² may carry clinically significant visceral fat and elevated liver enzymes. Standard BMI cut-offs systematically underestimate obesity prevalence in this population — meaning the 41 million figure is almost certainly an undercount.
KEY INSIGHT FOR CLINICIANS
The 2015 IAP BMI charts use lower adult cut-offs — overweight at 23 kg/m², obese at 25 kg/m² — specifically to account for India’s unique metabolic risk profile. Always apply IAP-adjusted charts, not CDC or NCHS standards, when screening Indian children. For patients near these thresholds, body composition analysis should be the immediate next step. Learn more about visceral fat in Indian patients.
Reason 3 — Suboptimal Early Nutrition and Breastfeeding Deficits
The nutritional programming hypothesis — that early-life metabolic exposure shapes lifelong disease risk — is robustly supported by evidence. According to the World Obesity Atlas 2026, 32.6% of Indian infants aged 1–5 months experience suboptimal breastfeeding. Exclusive breastfeeding for six months programs leptin sensitivity, adiponectin levels, and gut microbiome diversity — all of which reduce childhood obesity risk. Formula-fed infants show significantly higher adiposity gain in the first two years.
Complementary feeding practices compound the risk further. Early introduction of high-sugar, low-fibre weaning foods creates an adipogenic environment from the first year of life. India’s CNNS 2016–18 showed significantly higher overweight prevalence in children from higher wealth quintiles — inversely mirroring undernutrition patterns and confirming that overnutrition risk is rising fastest in precisely the families clinicians are least likely to flag.
- Children weaned on predominantly refined cereal-based complementary foods show 23% higher visceral fat accumulation by age 5 in South Asian cohort studies
- Maternal gestational weight gain above recommendations is an independent predictor of neonatal and childhood overweight
- Overweight prevalence in children aged 2–4 from the highest CNNS wealth quintile was more than 3× that of children in the lowest quintile
Reason 4 — Maternal Metabolic Health and the Intergenerational Transmission Risk
Childhood obesity in India is not only a childhood problem — it is an intergenerational one. The World Obesity Atlas 2026 reports that 13.4% of Indian women of reproductive age (15–49) have high BMI, and 4.2% live with Type 2 diabetes — both proven independent predictors of childhood obesity through distinct epigenetic, hormonal, and metabolic pathways.
Maternal obesity increases fetal adipogenesis via hyperinsulinaemia and hyperleptinemia in utero. Gestational diabetes mellitus (GDM) — whose prevalence in India ranges between 10–14.3% across states — exposes the fetus to chronic hyperglycaemia, programming insulin resistance that manifests as excess adiposity in early childhood.
Fetal Origins of Adult Disease: The Indian Context
The Developmental Origins of Health and Disease (DOHaD) framework is especially relevant in India, where the juxtaposition of maternal undernutrition and overnutrition creates a complex metabolic milieu. The ‘thin-fat’ phenotype at birth — low birth weight combined with disproportionately high body fat percentage — documented in South Asian neonates predisposes to early visceral adiposity accumulation when exposed to a post-natal calorie-surplus environment. This is a uniquely South Asian metabolic vulnerability with no reliable BMI-based detection pathway.
CLINICAL PEARL
Screen children of mothers with T2DM, GDM history, or BMI >23 kg/m² for early metabolic risk markers — fasting insulin, HOMA-IR, and waist-to-height ratio — from age 6 onwards, irrespective of their absolute BMI percentile. InBody body composition scanning should be included in this workup from the first visit.
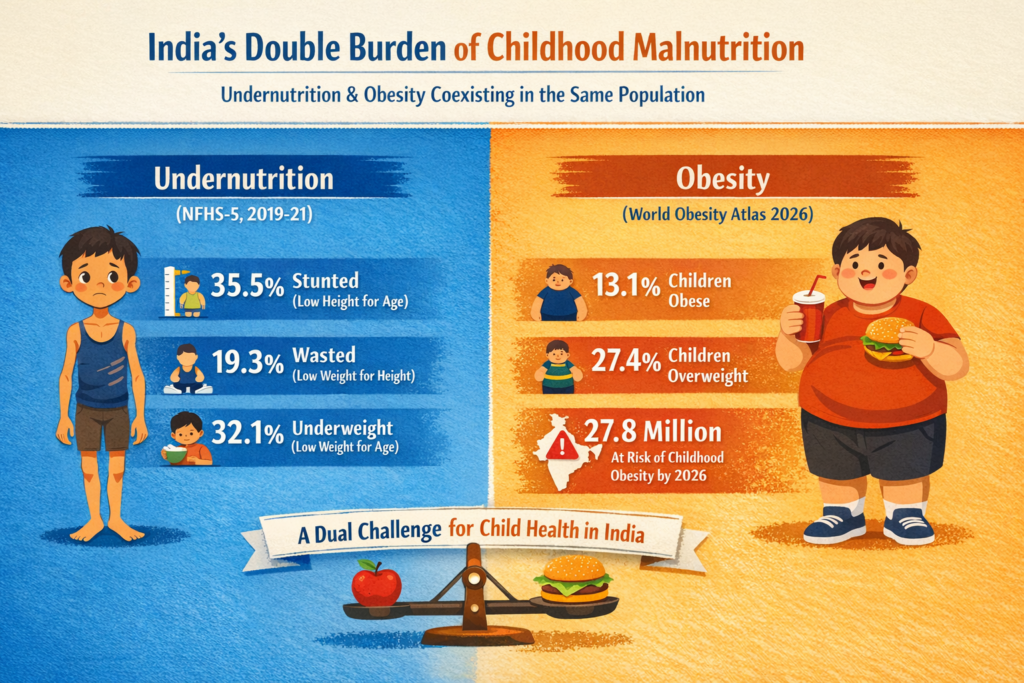
Reason 5 — The Double Burden: Undernutrition and Overnutrition Coexist
India is the only country of significant scale where a clinician can encounter moderate acute malnutrition and Grade II obesity in the same classroom, the same family, and sometimes — through intergenerational paradox — in different children of the same mother. UNICEF’s Child Nutrition Global Report 2025 confirmed that for the first time globally, the number of obese school-age children has surpassed the number of underweight children.
India exemplifies this double burden of malnutrition — a simultaneous public health crisis that profoundly complicates both clinical and policy responses. Programmes historically designed to address undernutrition, including ICDS and PM-POSHAN, now operate in a nutritional landscape where their supplementary caloric provisions may paradoxically accelerate overnutrition in certain subpopulations. Reforming these programmes to provide nutritionally complete rather than merely calorie-adequate interventions is a recognised and urgent gap.
Reason 6 — Inadequate School Nutrition and Obesogenic Food Environments
Only 35.5% of school-age children in India receive school meals through PM-POSHAN (formerly the Mid-Day Meal Scheme). While the initiative has improved school attendance and reduced undernutrition, nutritional quality — particularly micronutrient density and restriction of added sugars — remains inconsistent across states. More critically, the food environment surrounding Indian schools has become increasingly obesogenic.
Studies in metropolitan and tier-2 cities document widespread clustering of ultra-processed snack vendors, sugary beverage stalls, and fast-food outlets within 50 metres of school gates. Children aged 10–14 are particularly vulnerable, with pocket money and reduced parental supervision enabling independent food purchases several times per day.
Screen Time as a Dual-Channel Obesity Driver
Excess screen time accelerates childhood obesity through two independent pathways: (1) direct displacement of physical activity, and (2) exposure to digital marketing of energy-dense foods that shapes food preferences and increases hedonic eating behaviour. A 2023 Indian meta-analysis of 186,901 children aged 3–18 found an obesity prevalence of 8.4% — significantly higher than World Obesity Atlas figures, suggesting the 41 million estimate may itself be a systematic undercount.
- Children watching more than 2 hours of daily screen content show a 30% higher likelihood of overweight in longitudinal Indian studies
- 58% of digital food advertisements viewed by Indian children promote ultra-processed products
- Only 6 Indian states had any form of school food policy regulation in place as of 2024

Reason 7 — A Healthcare System Not Yet Calibrated for Paediatric Obesity
India’s primary healthcare infrastructure remains predominantly configured to detect and treat undernutrition and acute infectious disease in children. Systematic BMI screening, waist circumference measurement, and metabolic risk stratification during well-child visits are not yet standard across most PHC and community health facilities.
The World Obesity Atlas 2026 explicitly states that India is off track in achieving the global target to halt the rise in childhood obesity by 2030. Paediatric obesity in India also carries persistent cultural stigma — frequently framed by caregivers, and sometimes by clinicians, as a sign of prosperity rather than a medical condition requiring intervention. This normalisation delays presentation by years.
The clinical consequences of delayed detection are severe. The 2024 Indian Journal of Endocrinology and Metabolism meta-analysis confirmed that conditions traditionally considered adult — type 2 diabetes, metabolic-associated steatotic liver disease (MASLD), hypertension, and dyslipidaemia — are now being detected with increasing frequency in Indian children aged 8–15 in urban settings.
What Does Timely Clinical Intervention Actually Achieve?
Evidence from paediatric obesity intervention trials in South Asian populations consistently shows that structured lifestyle modification commenced before age 12 — combining dietary counselling, supervised physical activity, and family-based behavioural support — achieves a clinically meaningful 2–4% reduction in body fat percentage over 6 months. Early intervention also attenuates HOMA-IR progression and reduces carotid intima-media thickness, a surrogate marker of subclinical cardiovascular disease.
A CRITICAL DIAGNOSTIC GAP
InBody bioelectrical impedance analysis enables clinicians to detect high visceral fat and skeletal muscle deficits even in children with ‘normal’ BMI — the thin-fat phenotype that BMI systematically misses. Body composition screening is increasingly recognised as the standard of care in paediatric endocrinology across leading Indian tertiary centres. An InBody scan takes under 60 seconds and delivers results immediately.
BMI vs Body Composition Analysis: Why It Matters for Indian Children
BMI was developed in the 1830s as a population-statistics tool — not as a clinical measure of individual metabolic health. It uses only weight and height, cannot distinguish fat from muscle, and has no ethnic correction for South Asians who develop metabolic disease at BMI levels Western guidelines classify as healthy. Furthermore, it cannot detect visceral fat, skeletal muscle deficit, or early metabolic deterioration.
Body composition analysis with InBody measures five markers BMI completely ignores — each one critical for Indian children presenting in your clinic today.
| What You Need to Know | BMI | InBody Body Composition |
|---|---|---|
| Is this child carrying excess fat? | Partial — weight only, no fat detail | Yes — precise body fat % with IAP-specific ranges |
| Is skeletal muscle mass adequate? | No — cannot measure muscle at all | Yes — skeletal muscle mass in kg vs population norm |
| Is visceral fat at dangerous levels? | No — completely invisible to BMI | Yes — Visceral Fat Level on a 1–20 scale |
| Is the thin-fat phenotype present? | No — will show “normal” | Yes — detects high fat and low muscle simultaneously |
| Is systemic inflammation present? | No | Yes — ECW/TBW ratio flags cellular health |
| Does it account for Indian ethnicity? | No — uses Western population norms | Yes — Asian-specific reference values applied |
| Can it track the impact of intervention? | Unreliable — muscle gain raises BMI | Yes — tracks fat loss and muscle gain independently |
Real Case: The Child Who Was ‘Normal’ on Paper
A 13-year-old boy from a middle-class household in Pune was brought to a paediatric endocrinology clinic for a routine health check. His BMI was 21.3 — firmly within the healthy range on both CDC and IAP charts. His parents had no concerns. Nevertheless, his fasting glucose was borderline and he complained of persistent fatigue and poor concentration at school.
His InBody scan told a different story. It revealed a Visceral Fat Level of 10 (approaching high risk), a Body Fat Percentage of 29.4% (above the obesity threshold for Indian boys his age using IAP reference values), and Skeletal Muscle Mass 2.1 kg below norm for his height and age. He was a textbook presentation of the thin-fat Indian phenotype — and his BMI had missed it entirely.
After a 12-week programme of structured daily physical activity (60 minutes, mixed aerobic and resistance), reduced ultra-processed snack consumption, and increased dietary protein, his follow-up InBody scan showed measurable improvement across every metabolic marker. His BMI had moved by less than 0.4 units over the same period — a number that would have told his clinician nothing had changed.
| ↓2 units Visceral Fat Level reduction | +1.6 kg Skeletal Muscle Mass gained | ↓4.1% Body Fat Percentage reduction | Normal Fasting glucose at 12 weeks |
Which Children Should Be Screened for Obesity in India?
Body composition screening is clinically relevant for a much broader group of Indian children than standard BMI criteria suggest. In particular, the following groups benefit most from early InBody assessment:
- Children of mothers with T2DM, GDM history, or BMI >23 kg/m²: Intergenerational metabolic risk warrants screening from age 6, regardless of the child’s current BMI
- Children with normal BMI but borderline blood glucose, elevated liver enzymes, or persistent fatigue: The thin-fat phenotype is frequently the underlying cause and is only detectable through body composition analysis
- Urban children aged 8–15: The highest-risk demographic in terms of UPF consumption, screen time, and physical inactivity convergence
- Children on supervised weight or fitness programmes: InBody tracks fat loss and muscle gain independently, providing the clinically meaningful feedback that BMI cannot deliver
- Children with PCOS, prediabetes, or incidental fatty liver on imaging: Body composition data directly informs treatment intensity and targets
- Children over 10 with sedentary academic lifestyles: Early sarcopenic obesity — high fat combined with low muscle — is increasingly prevalent and largely invisible to standard clinical screening
Frequently Asked Questions
Q. What is the current childhood obesity rate in India?
As of 2025, the World Obesity Atlas 2026 estimates approximately 41 million Indian children aged 5–19 have high BMI, including 14 million classified as living with obesity specifically. India ranks second globally after China (62 million). Using IAP-adjusted BMI cut-offs, which use lower thresholds than CDC or WHO international standards, the true prevalence is likely considerably higher.
Q. Which age group is most affected by childhood obesity in India?
Adolescents aged 10–19 are most heavily affected, with more than 26 million classified as overweight or obese in 2025. However, the 5–9 age group accounts for nearly 14.9 million affected children — signalling very early onset of adiposity that is driven by early nutrition, screen time, and inactivity from primary school age onwards.
Q. What diseases are linked to childhood obesity in India?
Childhood obesity in India is the primary upstream driver of type 2 diabetes mellitus, hypertension, dyslipidaemia (particularly high triglycerides), metabolic-associated steatotic liver disease (MASLD/NAFLD), polycystic ovarian syndrome in adolescent girls, and subclinical cardiovascular disease. By 2040, BMI-related hypertension in Indian children is projected to rise to 4.21 million cases, hyperglycaemia to 1.91 million, and fatty liver disease to 11.5 million.
Q. Is BMI accurate for screening childhood obesity in Indian children?
No. BMI systematically underestimates adiposity in Indian children due to the thin-fat phenotype — higher body fat percentage at lower BMI values compared to Western populations. The IAP 2015 BMI charts with lower cut-offs (overweight: 23 kg/m², obese: 25 kg/m² equivalent) are recommended over CDC or WHO international standards. For clinical precision, body composition analysis using InBody BIA provides direct visceral fat level, body fat percentage, and skeletal muscle mass data that BMI cannot deliver — in under 60 seconds.
Q. What are the most effective interventions for childhood obesity in India?
Evidence supports a multi-pronged approach: 60 minutes of daily moderate-to-vigorous physical activity, restriction of ultra-processed food consumption, exclusive breastfeeding for the first 6 months, school-based nutrition education, regulation of digital food marketing to children, and family-based behavioural intervention commenced before age 12. Regular InBody body composition scanning allows clinicians and families to track fat loss, muscle gain, and visceral fat change objectively throughout the intervention — providing the motivational data that BMI or weight alone cannot.
Key Takeaways
- ✅ India has 41 million children living with overweight or obesity — the world’s second highest burden after China, growing at 5% per year with no signs of slowing.
- ✅ The 7 root causes — diet transition, physical inactivity, early nutrition deficits, maternal metabolic health, the double burden, school food environments, and healthcare system gaps — interact as a system, not in isolation.
- ✅ BMI systematically underestimates childhood obesity in India due to the thin-fat phenotype. Always use IAP 2015 BMI charts with lower cut-offs — not CDC or NCHS international standards — for Indian children.
- ✅ InBody body composition analysis detects visceral fat, skeletal muscle deficit, and body fat percentage in under 60 seconds — providing the clinical data BMI cannot, at the point of care.
- ✅ Structured lifestyle intervention before age 12 can achieve a 2–4% reduction in body fat and visceral fat normalisation. Body composition scanning is the only way to track this progress objectively.
- ✅ Without decisive action, 56 million Indian children will be overweight or obese by 2040 — with direct downstream consequences for India’s diabetes, cardiovascular disease, and liver disease burden for decades to come.
See What Your Child’s Body Is Really Made Of
An InBody scan takes under 60 seconds and gives clinicians the body composition data needed to detect childhood obesity risk that BMI will never show — visceral fat level, skeletal muscle deficit, and body fat percentage, all measured against Asian-specific reference values.
Find an InBody Scanner Near You
References & Further Reading
- World Obesity Federation. World Obesity Atlas 2026. Released World Obesity Day, March 4, 2026.
- UNICEF. Child Nutrition Global Report 2025. September 2025.
- Indian Journal of Endocrinology and Metabolism. Tackling the Rising Tide: Understanding the Prevalence of Childhood Obesity in India. 2024. PMC11189283.
- Sethi et al. Prevalence of overweight and obesity in India: Findings from CNNS 2016–2018. Pediatric Obesity. 2024. doi:10.1111/ijpo.13092.
- Indian Academy of Pediatrics. IAP BMI Charts for Indian Children. 2015 Revised Growth Standards.
- ICMR-NIN. Report on Diet and Disease Burden in India. 2024.
- WHO Expert Consultation. Appropriate body-mass index for Asian populations. The Lancet. 2004.
- Kaur SP. Epidemiology of childhood overweight and obesity in India: A systematic review. Indian Journal of Medical Research. 2014. PMC4859125.