
Body Composition 6 min read
How to Read a BCA Report: The 4 Numbers That Matter
Your body composition report has 15+ numbers. Four carry the meaning — and body fat percentage is not the one to read first. A section-by-section walkthrough.
Reading about body composition? Find an InBody test centre near you →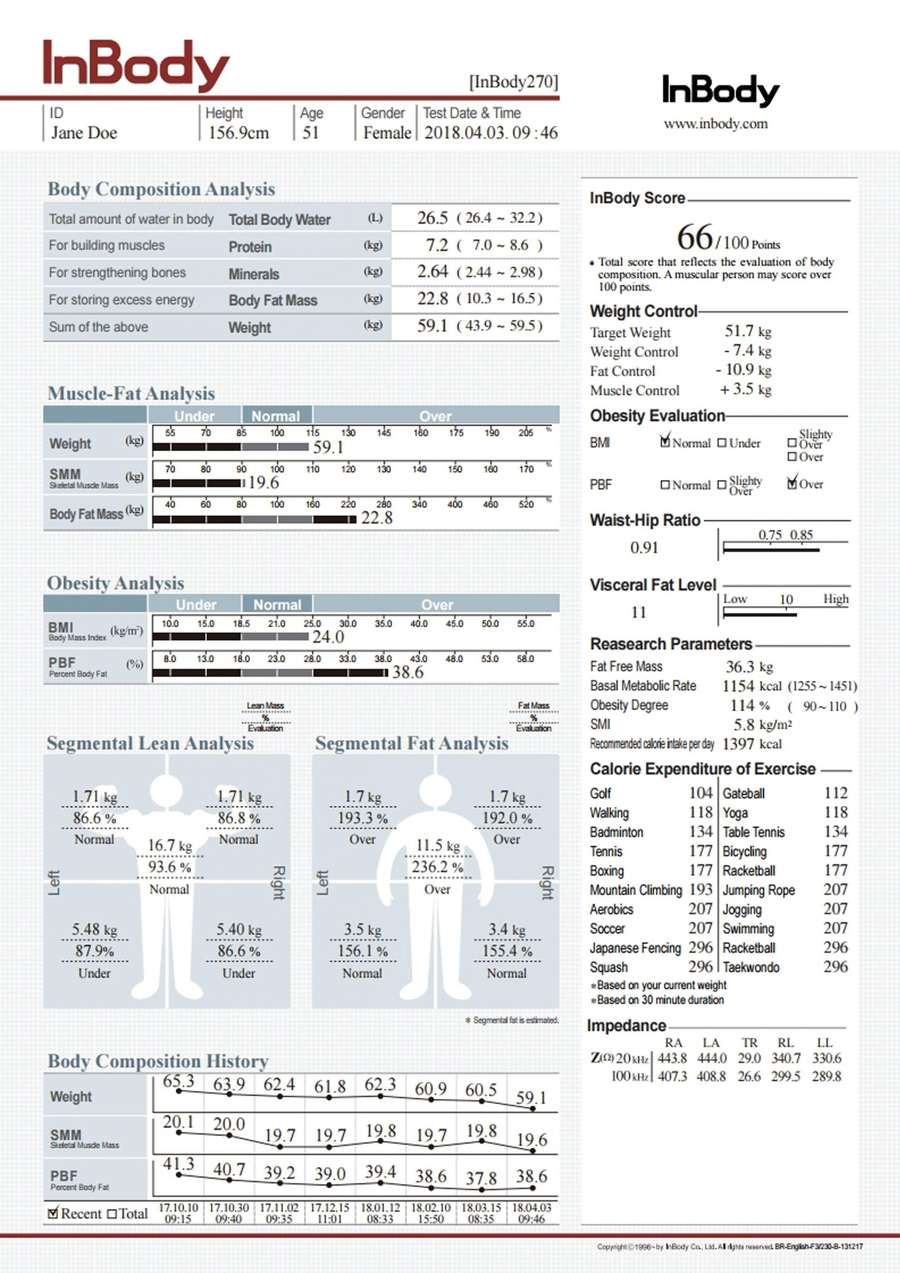
You Have the BCA Report. Now What Do the Numbers Mean?
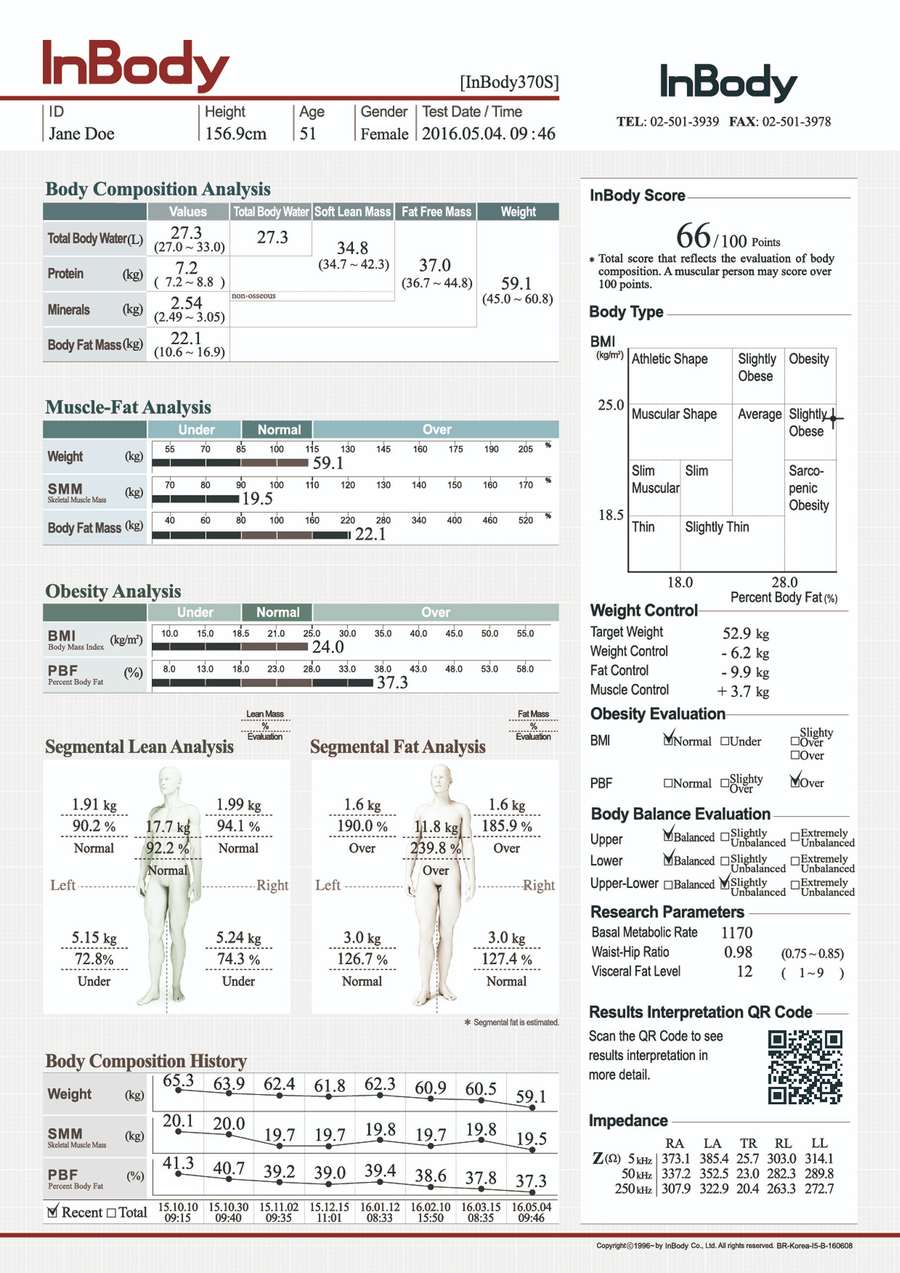
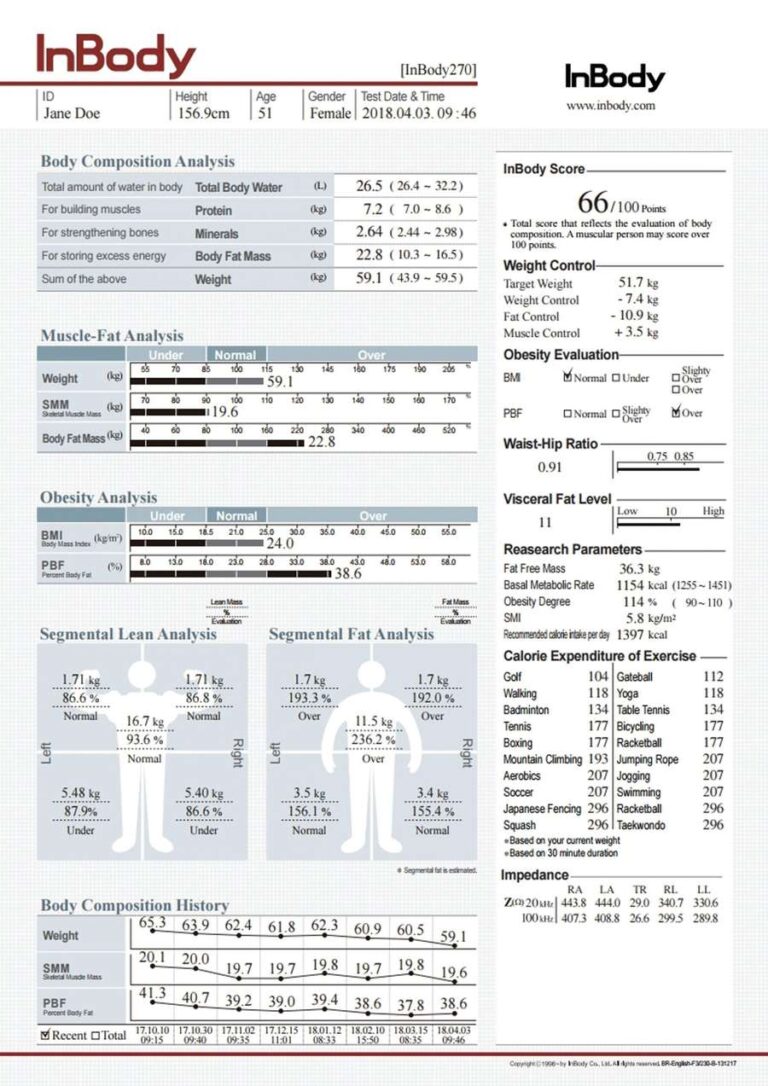
A BCA report — the printout from a body composition analysis — hands you fifteen or more numbers at once, several with names you have never encountered. Most people scan for body fat percentage, feel briefly good or bad about it, and put the sheet away.
That is a waste of a decent measurement. Four numbers on that sheet carry most of the meaning, and once you know which four and what they are telling you, the rest becomes supporting detail.
This guide walks through a BCA report section by section, in the order worth reading it — which is not the order it is printed in.
First: Ignore Body Fat Percentage for a Moment
Counterintuitive, but useful. Body fat percentage is the number everyone jumps to, and read alone it is the easiest to misinterpret. It is a ratio — fat divided by total weight — which means it moves when either number moves. Lose muscle and your body fat percentage rises without gaining a gram of fat.
Read the composition figures in kilograms first, then come back to the percentage with context.
The Four Numbers That Carry the Meaning
1. Skeletal Muscle Mass (SMM)
The muscle attached to your bones — the muscle you can train, and the muscle you lose with age or aggressive dieting. Reported in kilograms.
This is the most important number on the sheet and the one no weighing scale can see. What matters is less the absolute figure on day one than its direction across repeat tests. Falling SMM while body weight holds steady is the single most common and most consequential pattern in Indian adults over 35, and it is invisible without measurement.
Your report will usually show SMM against a reference range for your height. Below the range is worth acting on. Within it and falling over time is also worth acting on.
2. Body Fat Mass
Total fat in kilograms. Read alongside SMM rather than in isolation. The pairing tells you what actually happened between two tests:
| SMM | Body Fat Mass | What it means |
|---|---|---|
| Up | Down | The ideal outcome — body recomposition, often at unchanged body weight |
| Flat | Down | Good fat loss with muscle preserved |
| Down | Down | Weight loss that cost you muscle — common with aggressive dieting and low protein |
| Down | Up | The pattern worth interrupting; frequently occurs at stable body weight |
| Up | Up | Gaining both — usually a surplus that needs adjusting |
Row three is why the scale is a poor guide. It reports a success.
3. Visceral Fat
The fat packed around your abdominal organs, reported as a level or, on clinical devices, as visceral fat area in cm². Above 100 cm² is the recognised threshold for elevated metabolic risk.
This is arguably the most clinically important number on an Indian BCA report. Visceral fat is metabolically active in ways subcutaneous fat is not, with established associations to insulin resistance and cardiovascular risk — and it can sit elevated in someone whose body weight and BMI are entirely normal. That combination is common enough in India to have a name in the literature: the thin-fat phenotype. More detail in visceral fat normal range and risks.
4. Segmental Lean Analysis
Muscle measured separately in your right arm, left arm, trunk, right leg and left leg. Usually shown as bars with a percentage against expected.
Two things to look for. Left-right asymmetry — a meaningful difference between limbs often traces to an old injury, a dominant-side habit, or uneven training. Trunk development relative to limbs, which matters for back health and general function.
This section is where a trainer or physiotherapist can act most specifically. A whole-body muscle figure averages exactly these imbalances into invisibility.
The Supporting Numbers
- Total Body Water, ICW and ECW. Total water split into intracellular and extracellular. The ratio between them is a fluid-balance indicator — a raised extracellular proportion can reflect inflammation, oedema or fluid retention. On clinical models this is a genuinely useful output; on a fitness report it mostly provides context for why a reading shifted.
- Basal Metabolic Rate (BMR). Estimated energy expenditure at rest, driven largely by lean mass. Useful as an anchor for nutrition planning. Note that it rises as you gain muscle — one of the practical arguments for defending SMM during fat loss.
- BMI. Present on the sheet for reference. Now that you have the composition figures, it adds little. Indian cut-offs are lower than Western ones — overweight from 23, obesity from 25 under ICMR and WHO Asia-Pacific guidance — but the limitation remains that BMI cannot distinguish muscle from fat.
- InBody Score or equivalent summary. A single figure summarising overall composition, useful for quick tracking. Explained fully in the InBody Score explained.
Reading Your Second Report Against Your First
This is where a BCA report stops being trivia and becomes information. When comparing two reports:
- Confirm conditions were comparable. Similar time of day, both before training or both after, neither straight after a heavy meal or a large volume of water. If conditions differed substantially, treat differences cautiously — bioelectrical impedance responds to hydration.
- Compare SMM and Body Fat Mass in kilograms first, not percentages. Percentages move for reasons that have nothing to do with fat.
- Check whether the direction matches your intent. If you were aiming to lose fat and SMM has dropped by a kilogram, the approach needs adjusting — usually more protein and resistance training, less aggressive deficit.
- Look at visceral fat separately. It can improve meaningfully even when total body fat moves modestly.
- Allow enough time. Six to eight weeks between tests. Shorter intervals mostly capture water.
What a BCA Report Cannot Tell You
Worth being clear, because it is what makes the rest trustworthy:
- It does not measure bone mineral density. Osteoporosis assessment requires DEXA.
- It does not diagnose disease. It provides markers a clinician interprets alongside history and blood work.
- It does not tell you where fat will be lost from. Nothing does.
- A single report cannot distinguish a genuine change from a hydration shift. Only repeat testing under consistent conditions can.
Three Things Worth Doing After Reading Your Report
- Write down your SMM, Body Fat Mass and visceral fat. These three, in kilograms and level, are your baseline. Keep the report.
- Book the re-test now, six to eight weeks out, at a similar time of day and preferably on the same device.
- Pick one thing to change. If SMM is low or falling, that is resistance training and adequate protein. If visceral fat is elevated, that is the broader diet and activity pattern. One change, measured, beats five changes unmeasured.
Get a Baseline Worth Comparing Against
A report you understand is a report you will act on. If you do not have one yet, or your last one predates any real change in routine, start a fresh baseline.
Book an InBody body composition test at inbody.in/inbody-test.php, or find a centre near you at inbody.in/locations. Related reading: how to read an InBody results sheet, the InBody Score explained, and visceral fat ranges and risks.

Most trending articles
वज़न बढ़ाने के लिए क्या खाएं? सही डाइट प्लान (सिर्फ ज़्यादा खाना नहीं)
सिर्फ ज़्यादा खाने से मांसपेशी नहीं बनती, चर्बी बढ़ सकती है। सही कैलोरी सरप्लस, प्रोटीन और डाइट प्लान जो वज़न को सही तरीके से बढ़ाए — पूरी जानकारी हिंदी में।
भारत में प्रोटीन कितना ज़रूरी है? असली आंकड़े और सही फॉर्मूला
IMRB के एक सर्वे में लगभग 73% भारतीय आहार प्रोटीन-कम पाए गए। सही प्रोटीन टारगेट कैसे निकालें और किन फूड्स से पूरा करें — पूरी जानकारी हिंदी में।
Metabolic Age क्या होती है? आपकी उम्र से ज़्यादा है या कम?
आपकी असली उम्र 34 है पर शरीर 50 साल जैसा व्यवहार कर सकता है। Metabolic age क्या है, मांसपेशी घटने के जोखिम क्या हैं और इसे कैसे घटाएं — पूरी जानकारी।