A section-by-section guide to every number on your InBody printout — what it means, what's normal, and what to do about it.
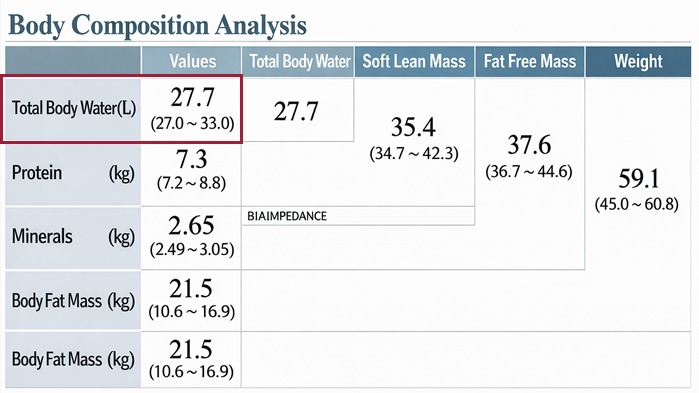
The top of your sheet reveals the four building blocks of your body weight — each with a normal range bar to assess where you stand.
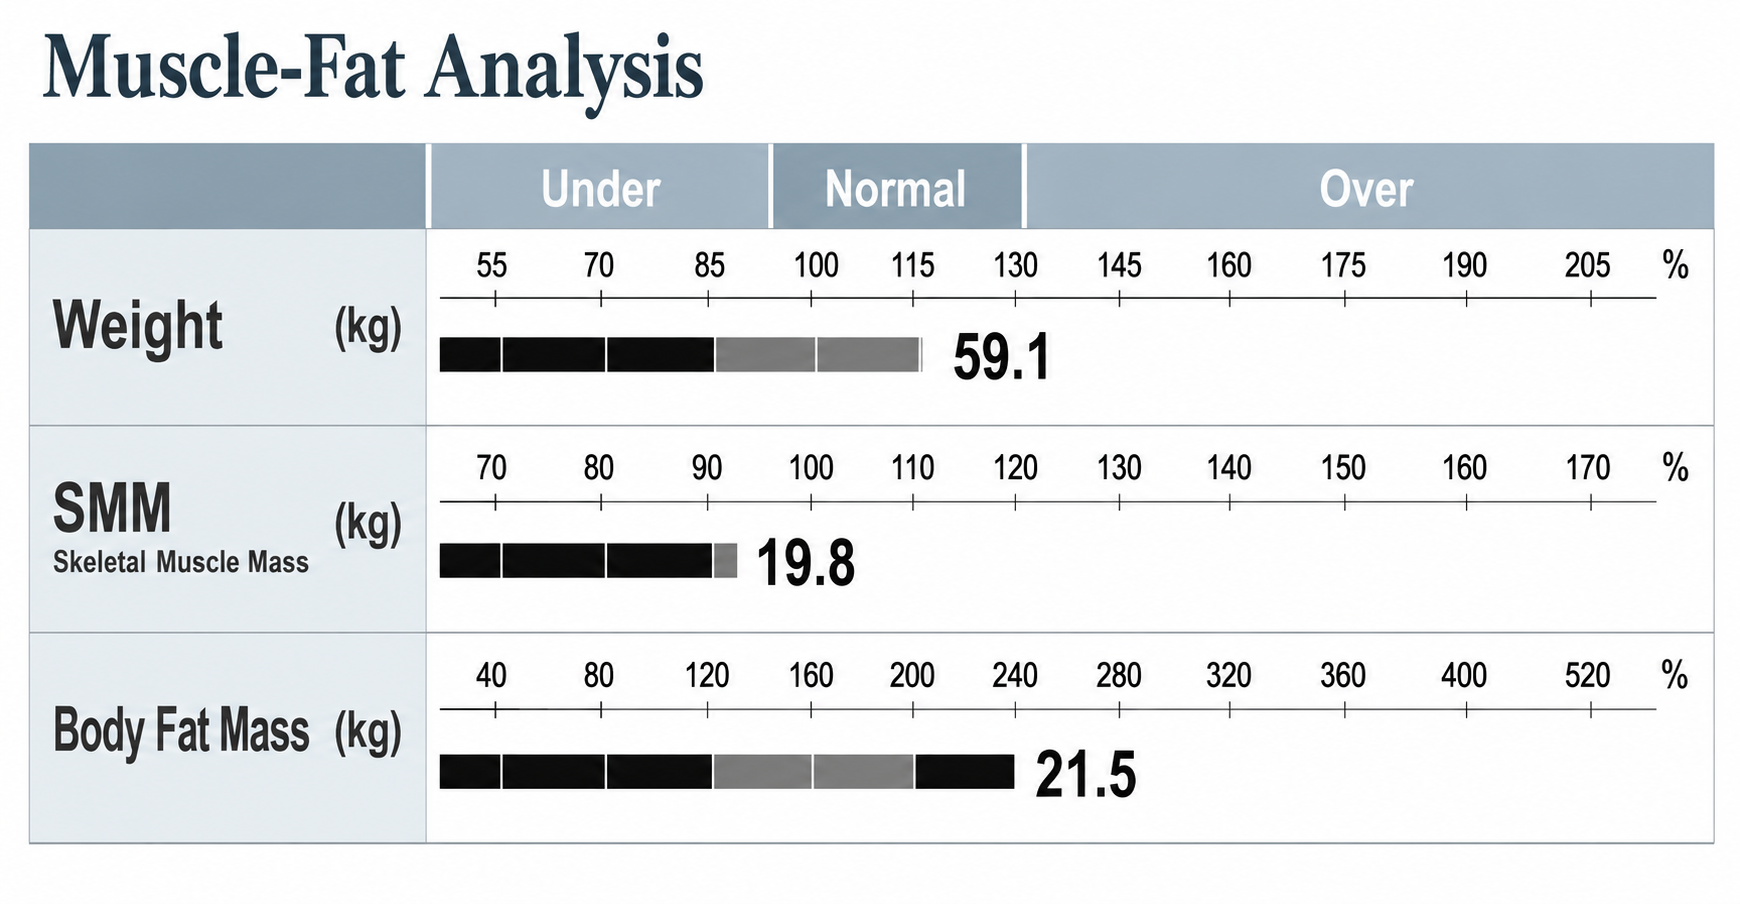
Three bars — Weight, Skeletal Muscle Mass (SMM), and Body Fat Mass (BFM) — reveal your body type at a glance.
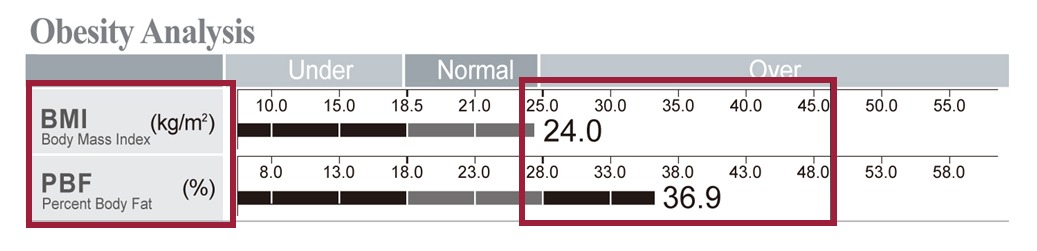
BMI — weight ÷ height². Indian healthy range: 18.5–22.9, lower than international norms due to higher visceral fat risk.
PBF (Percent Body Fat) — the more important number. Indian men: 15–20% healthy. Indian women: 23–28% healthy.
BMI normal but PBF high? You may be "skinny fat" — extremely common in Indians.
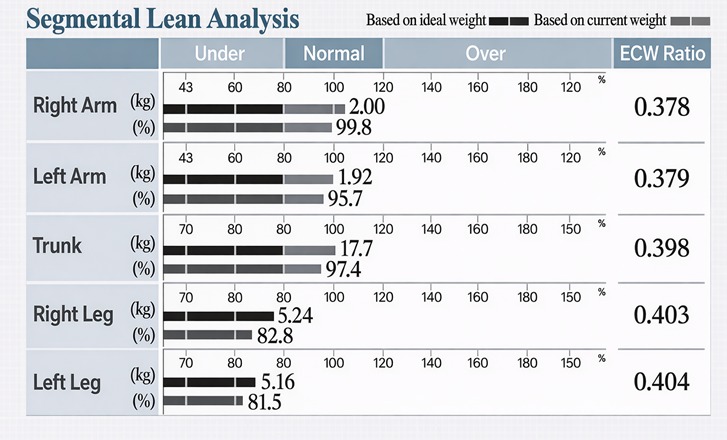
Five bars showing muscle mass in each arm, each leg, and the trunk — with actual kg and % of normal.
Look for symmetry. A difference of more than 0.5 kg between left and right limbs may indicate injury, postural issues, or training imbalance.
Trunk muscle below 90% of normal is a sarcopenia warning — especially in adults over 50.
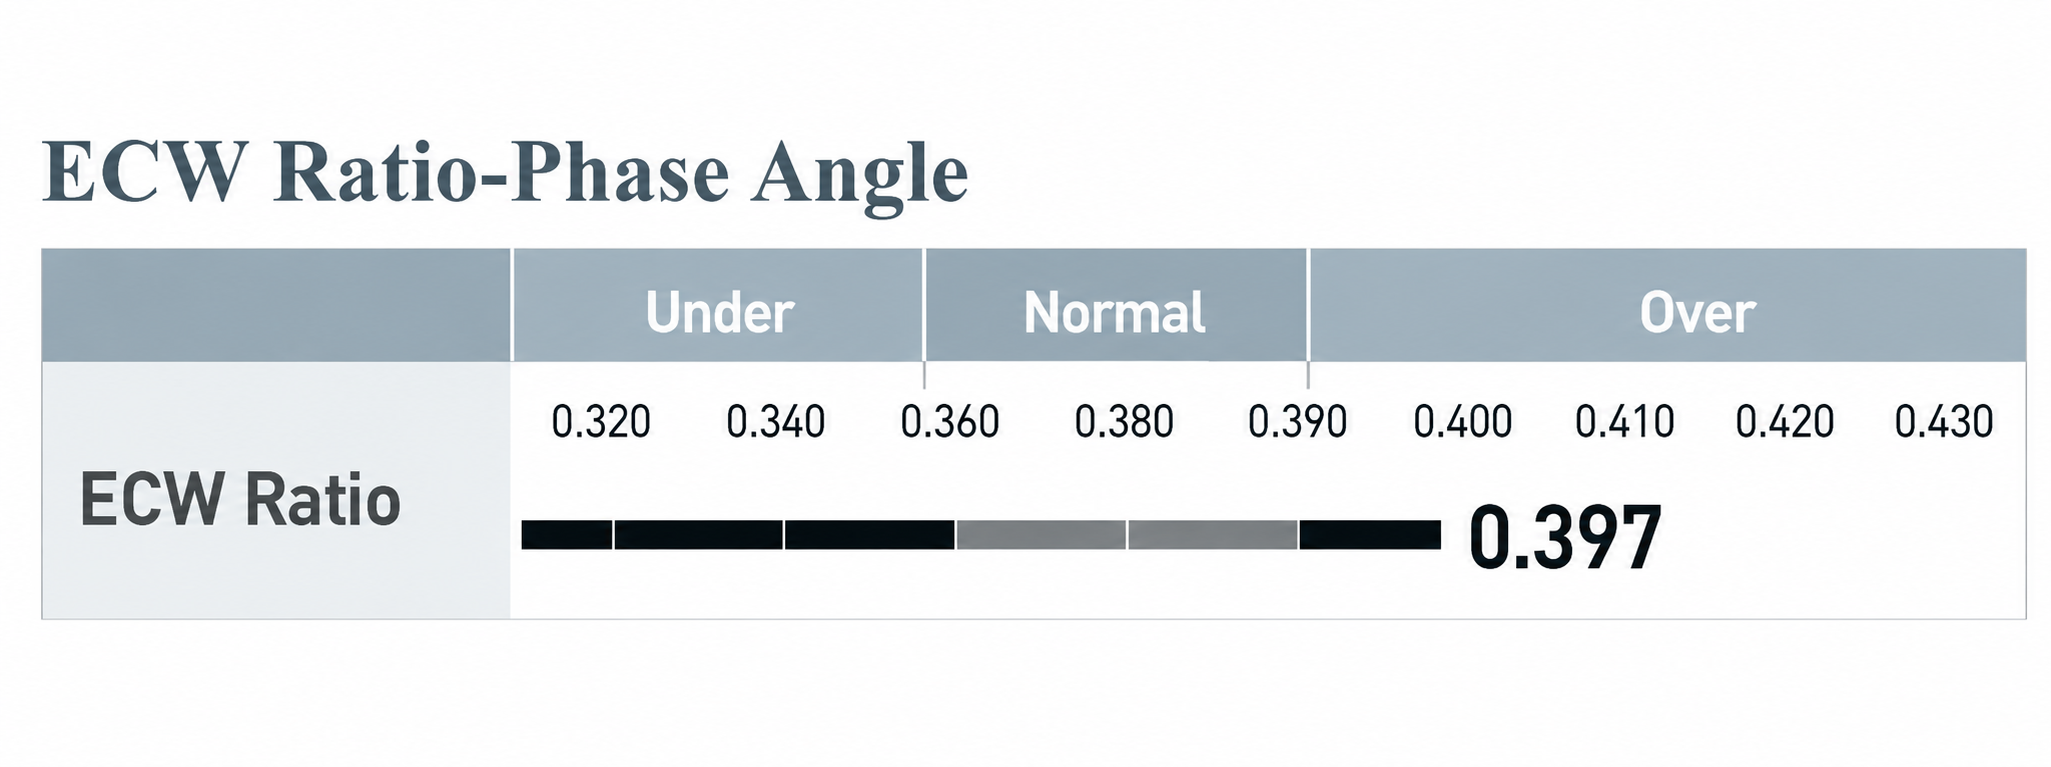
Extracellular Water ÷ Total Body Water. One of the most clinically important numbers on your sheet.
| Range | Meaning |
|---|---|
| 0.36 – 0.39 | Normal — healthy fluid balance |
| 0.39 – 0.40 | Mild fluid imbalance — monitor |
| > 0.40 | Edema/inflammation — kidney, heart, liver |
Available on InBody 270S, 380, 570, 770S, 970S, S10.
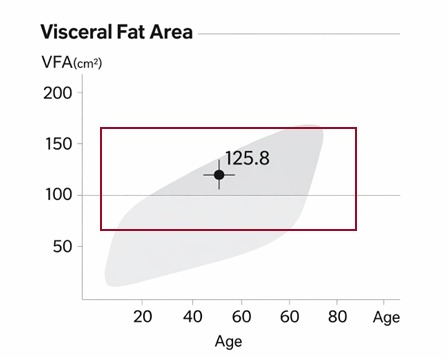
Fat around your organs — linked to diabetes, heart disease, and metabolic syndrome. Scored 1–30.
| Level | Status |
|---|---|
| 1 – 9 | Healthy |
| 10 – 14 | Elevated — action recommended |
| 15+ | High risk — diabetes & heart disease |
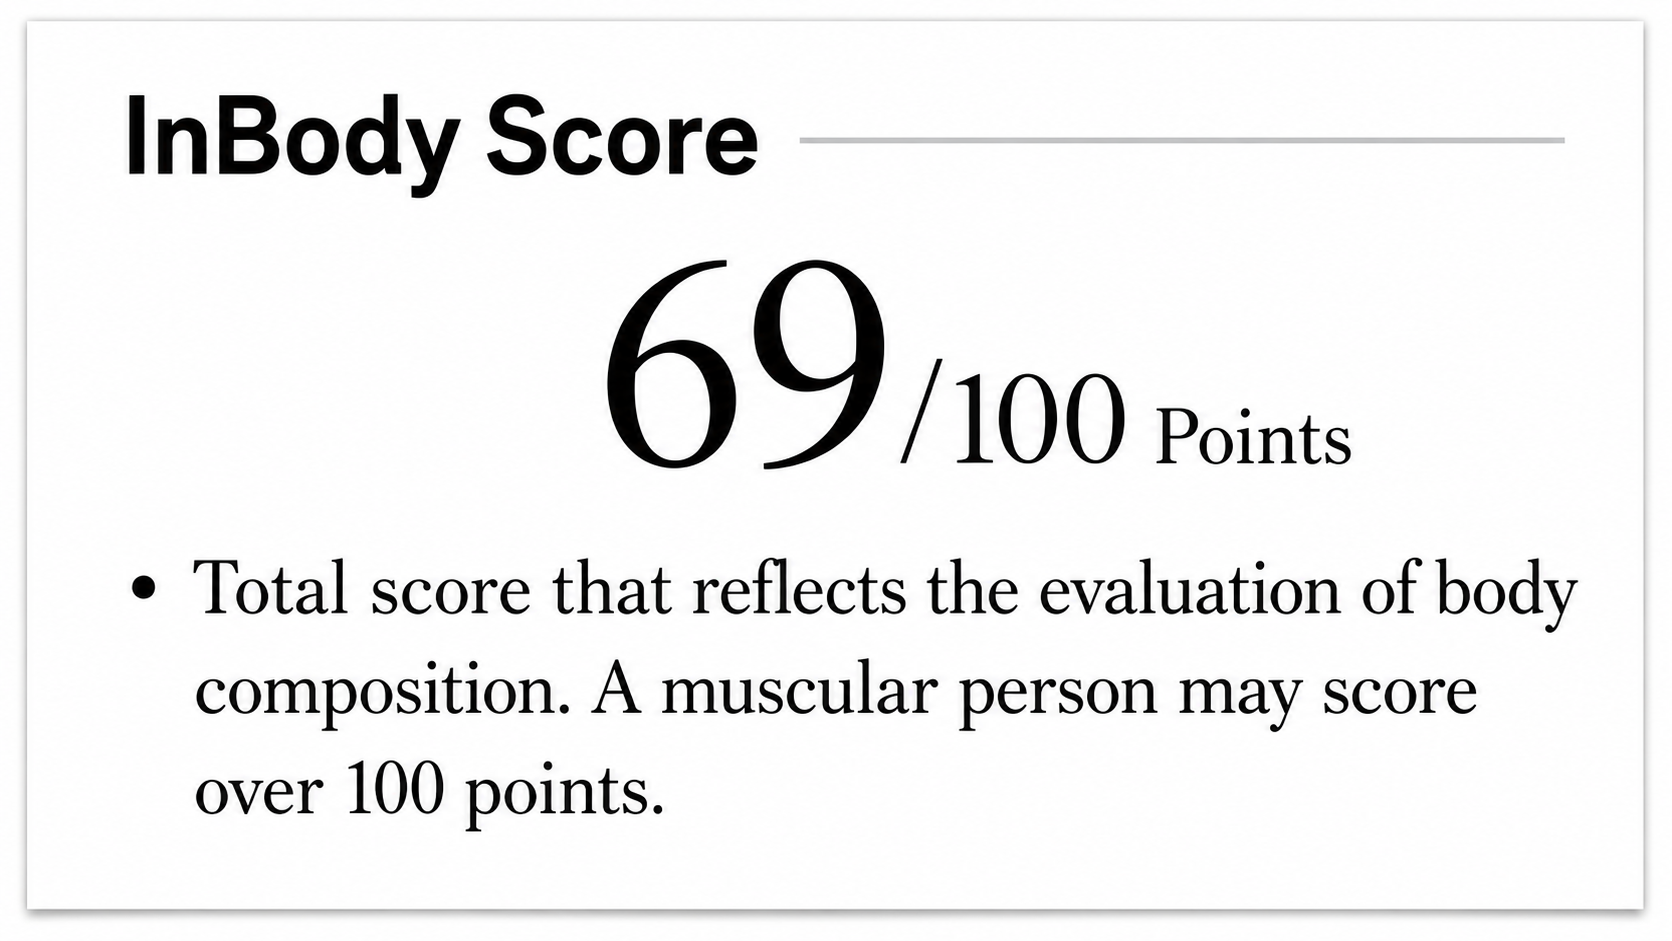
A single 0–100 number summarising your overall body composition. Use it as your single trend tracker over weeks and months.
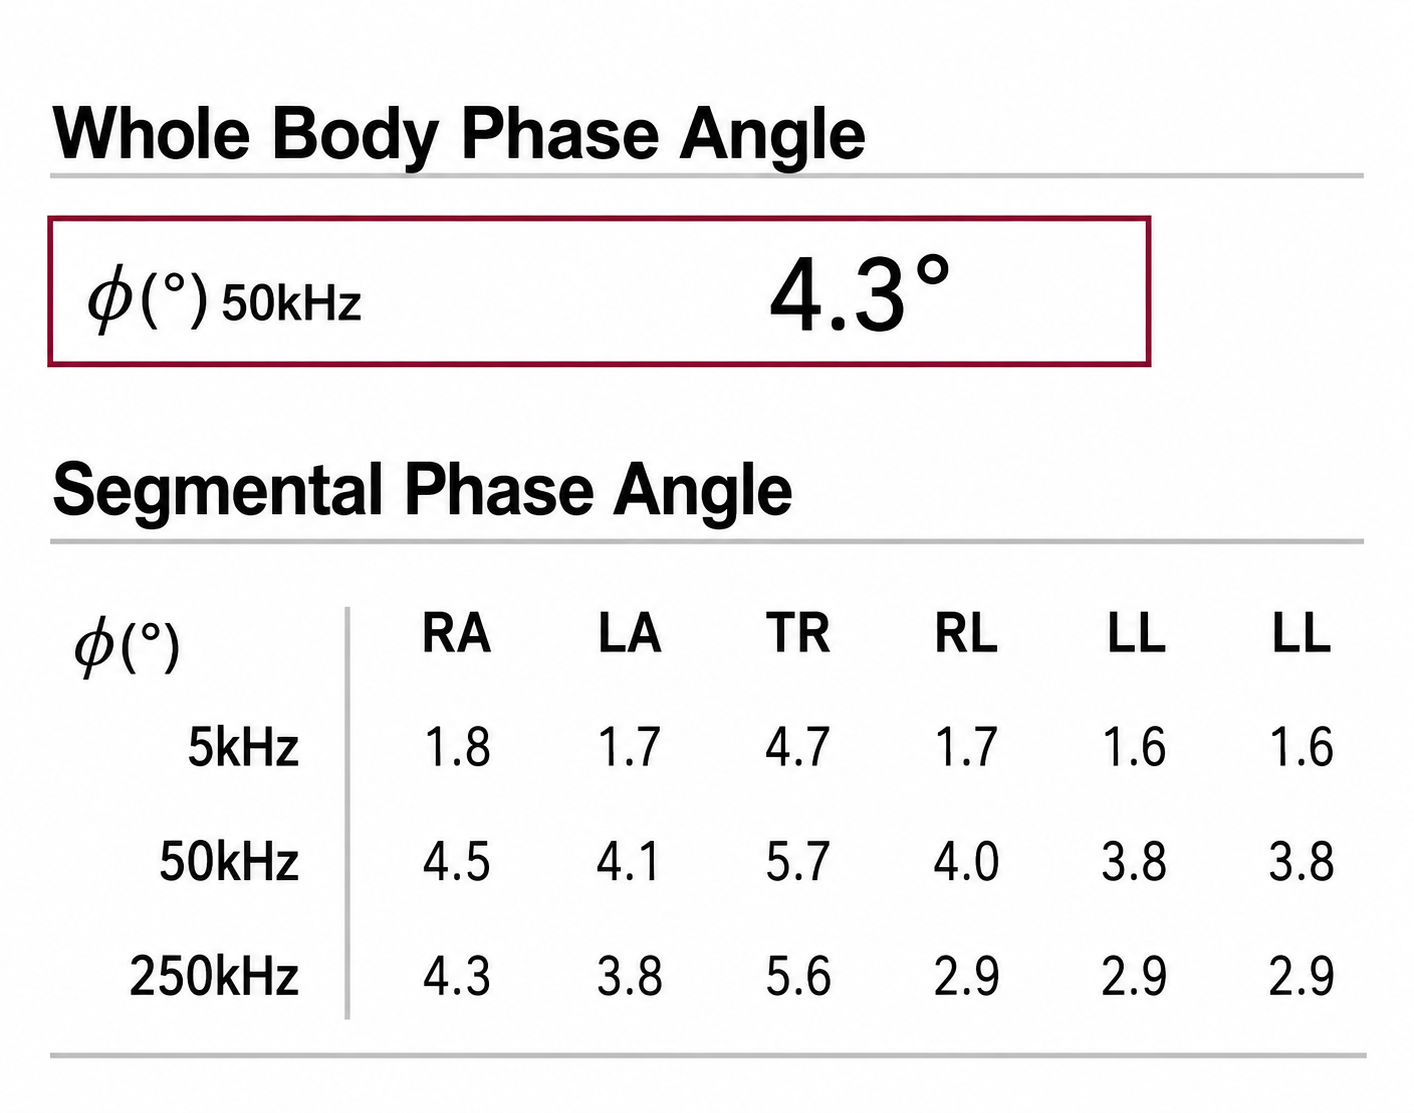
A marker of cellular health and membrane integrity, measured in degrees (°). Available on InBody 770S and 970S.
| Group | Normal Range |
|---|---|
| Indian Men, 20–50 yrs | 5.5 – 7.5° |
| Indian Women, 20–50 yrs | 5.0 – 6.5° |
| Athletes | 7.0 – 9.0° |
| Elderly / Clinical Concern | < 4.5° |
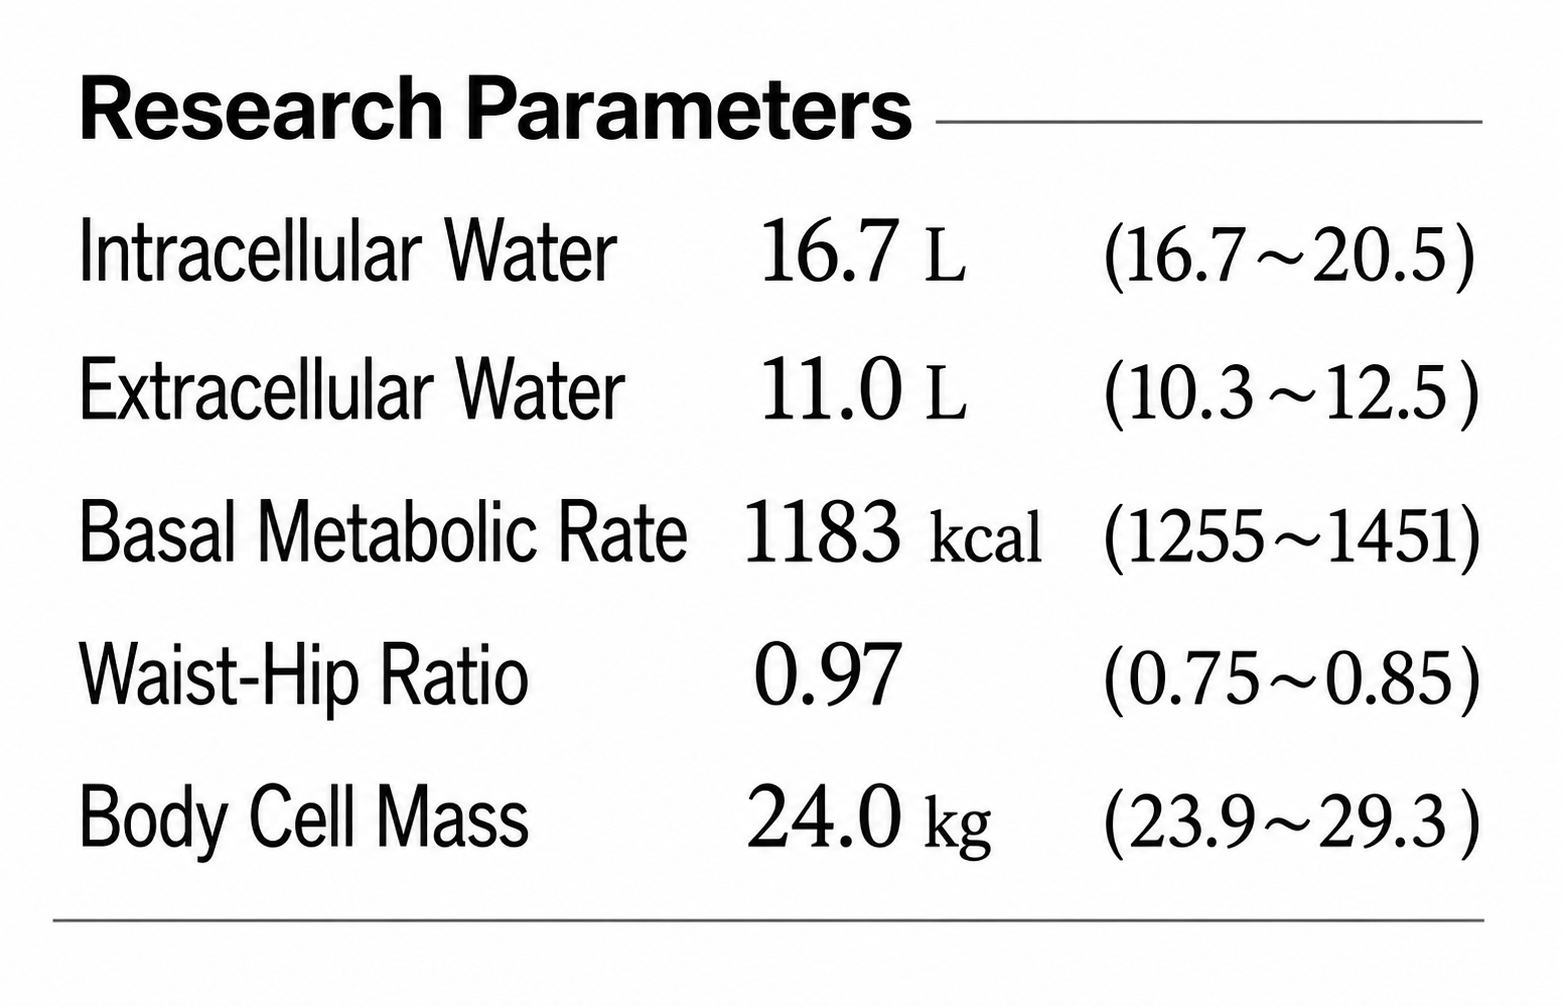
Calories burned at rest — calculated from your actual lean body mass. Far more accurate than age + weight estimates.
Key insight: More muscle = higher BMR. Building muscle is the most powerful long-term fat loss strategy.
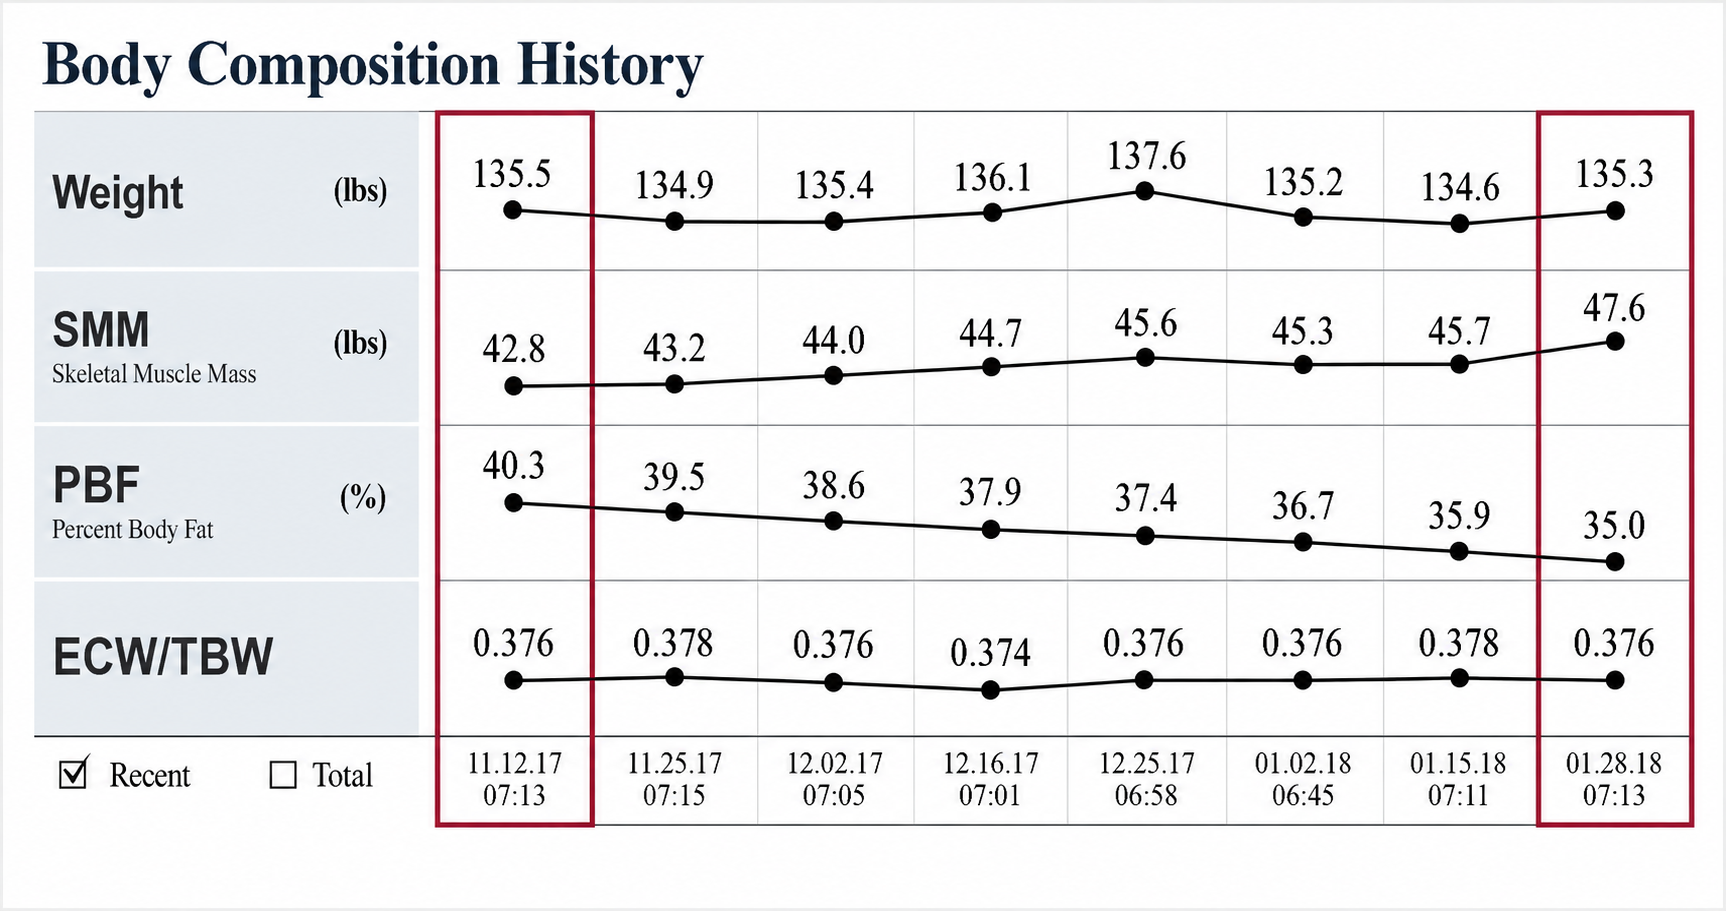
A timeline showing how weight, skeletal muscle, and body fat % have changed across all your tests.
The ideal pattern: Weight stable or slowly down, skeletal muscle up, body fat % down. This is true body recomposition.
Scale weight alone hides this progress — InBody history reveals it.
Tested at any of 1,500+ InBody centres in India — full result sheet in 60 seconds.