
Body Composition 22 min read
Diabetes Reversal: Is It Possible? The Evidence-Based Plan
An estimated 101 million people in India live with diabetes, and only China has more adults with the condition.[1][2][3] Many are monitored with HbA1c, fasting glucose, and body…
Reading about body composition? Find an InBody test centre near you →
An estimated 101 million people in India live with diabetes, and only China has more adults with the condition.[1][2][3] Many are monitored with HbA1c, fasting glucose, and body weight. These tools tell you where blood sugar has been. They don’t explain why it got there, and they cannot tell you what to change to make it better. The result is a diabetes management approach that treats a body-composition disease using metabolic markers that measure its consequences rather than its causes.
The science of body composition in diabetes has advanced dramatically in the last decade. We now know that skeletal muscle takes up roughly 80% of insulin-stimulated glucose under experimental clamp conditions,[4] and that higher visceral fat mass is strongly linked to type 2 diabetes.[5] Also, in one large chart review, BMI identified obesity in only 32.4% of patients with type 2 diabetes, against 71.5% when body fat percentage was used.[6] And InBody body composition technology can measure all of this in under 60 seconds. In this article, we reveal the 7 most important body composition secrets that transform diabetes management and explain exactly how to apply each one.
| 101M Indians estimated to be living with diabetes in 2021 (ICMR-INDIAB), second only to China in absolute numbers[1][3] | 80% Of insulin-stimulated glucose uptake occurs in skeletal muscle (euglycaemic clamp studies)[4] | 71.5% of T2DM patients classified as obese by body fat % vs only 32.4% by BMI (InBody 770, Taiwan chart review, n=2,404)[6] | 4× Higher odds of T2DM per kg increase in visceral fat mass in women (OR 4.24; Scientific Reports 2019 meta-analysis of observational studies)[5] |
Why HbA1c and BMI Are Not Enough
HbA1c measures the average blood glucose over approximately three months.[7] It is an essential tool for monitoring glycaemic control. But it tells you nothing about why blood glucose is elevated. Is it because visceral fat is driving insulin resistance? Or is it because skeletal muscle mass has declined and glucose disposal capacity is reduced? Is it because intramyocellular lipid accumulation is impairing insulin signalling at the cellular level? HbA1c cannot distinguish between these causes. Body composition analysis can help.
BMI compounds the problem. A retrospective chart review of 2,404 patients with T2DM in Taiwan, using InBody 770, found that 71.5% of patients were obese by body fat percentage (25% or more in men, 30% or more in women), yet only 32.4% met the BMI threshold for obesity used in that study (27 kg/m² or above, the Taiwanese cut-off).[6] The 39.1-point gap means that many patients with excess body fat were not flagged as obese by BMI. Their body composition may not have been factored into how their diabetes was being managed.
THE INDIAN METABOLIC BLIND SPOT
Many Asian Indians develop type 2 diabetes at lower BMI levels than people of European ancestry, and a substantial proportion of Asians are at high risk of diabetes below the international overweight cut-off of BMI 25.[2][8] The “thin-fat” Indian phenotype, higher body fat and more visceral fat at the same BMI,[9][10] means that metabolic risk can be underestimated by BMI in exactly the patients who need intervention most. For every Indian diabetic patient you are managing with HbA1c and body weight alone, you may be missing body composition information that helps explain their glucose control. Learn more about why BMI misses what body composition reveals.
Secret 1: Visceral Fat, Not Total Weight, Is a Major Contributor to Insulin Resistance
Visceral fat is not metabolically inert. It drains directly into the portal circulation, generates free fatty acids, and carries more inflammatory and immune cells than subcutaneous fat.[11] Inflammatory pathways and ectopic lipid accumulation in tissues such as skeletal muscle and liver have been implicated in impaired insulin signalling at the cellular level.[12] Obesity is also associated with lower levels of adiponectin, an adipose-derived hormone that sensitises the body to insulin,[13] so a growing amount of visceral fat may contribute to worsening insulin resistance.
A Scientific Reports 2019 systematic review and meta-analysis of observational DEXA studies found that every 1 kg increase in visceral fat mass was associated with 2.28 times the odds of T2DM in males (95% CI 1.42 to 3.65) and 4.24 times in females (95% CI 1.64 to 11.02).[5] The wide confidence intervals and the observational design mean these figures show an association rather than proof of cause, but the direction is consistent: more visceral fat, higher odds of diabetes. Visceral fat is also largely invisible to BMI and body weight measurement.
CLINICAL IMPLICATION
For every T2DM patient presenting with poor glycaemic control, consider measuring their visceral fat level with InBody when reviewing their management plan. On InBody’s scale, a Visceral Fat Level (VFL) of 10 or above (a visceral fat area above about 100 cm²) is the point at which the risk of lifestyle diseases is considered to increase,[14] and it can occur even at a normal BMI. Medication alone may not address excess visceral fat. You cannot target what you cannot measure.
Secret 2: Your Patient’s Legs Are a Key Metabolic Organ in Diabetes
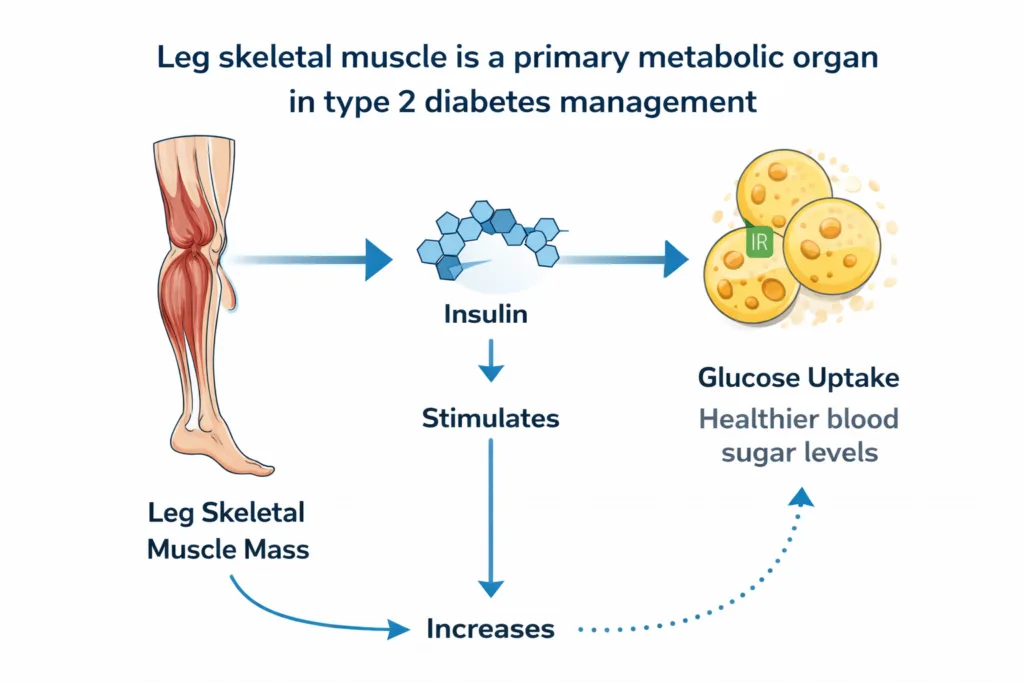
Skeletal muscle takes up approximately 80% of insulin-stimulated glucose under experimental clamp conditions.[4] The large muscles of the legs make up a substantial share of the body’s skeletal muscle, which makes them an important tissue for blood glucose regulation. In a US national survey of 13,644 adults, higher skeletal muscle mass relative to body weight was associated with lower insulin resistance, lower HbA1c, and a lower prevalence of diabetes, and each 10% increase in the skeletal muscle index was associated with an 11% lower insulin resistance score after adjusting for age, sex, ethnicity, and obesity.[15]
This is one reason resistance training, including lower-body resistance exercise, is a useful part of diabetes care. In a network meta-analysis of 158 randomised trials (17,059 people with T2DM), resistance training lowered HbA1c by about 0.40 percentage points compared with control, similar in direction to aerobic training (0.58) and combined training (0.58), while high-intensity interval training showed the largest reduction (0.61).[16] Building muscle is thought to increase the body’s glucose disposal capacity, which may help reduce post-meal glucose excursions.
KEY INSIGHT
InBody’s segmental lean analysis measures the lean mass of each limb independently: right arm, left arm, trunk, right leg, and left leg. This allows clinicians to identify a leg muscle deficit specifically, a finding that is relevant for a T2DM patient, rather than relying on total muscle mass averages that can obscure localised deficits. A patient with adequate total muscle mass but below-norm leg lean mass may have a localised deficit that the total figure hides.
Secret 3: Diabetes Can Cause Sarcopenia. And Sarcopenia Can Make Diabetes Worse
The relationship between T2DM and sarcopenia is thought to be bidirectional, with each condition making the other more likely. An Indian expert consensus recognised this relationship,[17] and reviews describe several overlapping ways in which diabetes can harm muscle: insulin resistance and impaired muscle protein metabolism, chronic low-grade inflammation, oxidative stress, mitochondrial dysfunction, and hyperglycaemia.[18][19] Reduced physical activity, for example because of fatigue or neuropathy, may further accelerate muscle loss.
In the other direction, sarcopenia may contribute to the development and progression of diabetes, through reduced glucose disposal capacity due to low muscle mass and increased local inflammation.[18] As skeletal muscle mass declines, glucose disposal capacity can fall and glycaemic control can worsen. Diet and medication adherence matter, but muscle loss may be an additional, easily missed contributor to progression in patients whose muscle mass is never measured.
The same Taiwanese chart review of 2,404 T2DM patients using InBody 770 found that the prevalence of low muscle mass was 28.0% and sarcopenic obesity was 18.7%, both increasing with age.[6] Among patients with a normal BMI (18.5 to under 24 kg/m²), 55.6% had low muscle mass. HbA1c and BMI do not show this.
THE SARCOPENIC DIABETES TRAP
A T2DM patient who gradually loses skeletal muscle may find it harder to maintain the same HbA1c, not necessarily because their adherence has worsened, but because their glucose disposal capacity may have declined. Without serial skeletal muscle mass measurement, this muscle loss can go unnoticed, and a useful response (such as resistance training and attention to protein intake, discussed with the care team) may never be considered.
Secret 4: BMI Misses Obesity in Many Diabetic Patients. Body Fat Percentage Catches More of It
The InBody 770 chart review of 2,404 T2DM patients in Taiwan is a useful illustration of this point.[6] When obesity was defined by body fat percentage (25% or more in men, 30% or more in women), 71.5% of patients were obese. When obesity was defined by BMI (27 kg/m² or above in that study), only 32.4% were obese. The discrepancy is 39.1 percentage points: roughly four in ten T2DM patients in this cohort had a high body fat percentage without meeting the BMI definition of obesity.
This has direct consequences for clinical decision-making. Patients classified as normal weight by BMI but obese by body fat percentage may be less likely to be counselled on weight loss or referred to dietitians, and their lipid and cardiovascular risk may be taken less seriously. If so, this is less a matter of clinician neglect than of a screening tool that misclassifies them.
EVIDENCE
The authors of the same chart review describe the InBody 770 multi-frequency BIA as a “universal, convenient, instantaneous, non-invasive, and highly accurate” bioelectrical impedance analyzer.[6] That is the authors’ own description rather than a finding of their study, and independent comparisons with DXA show small individual errors but a systematic bias, with InBody models tending to under-read body fat percentage and fat mass.[20] For Indian patients, body-fat reference values derived from Asian Indian populations are more appropriate than Western norms, because Asian Indians tend to carry more body fat at the same BMI.[9]
Secret 5: ECW/TBW Ratio Can Add an Early Clue to Diabetic Complications
The ECW/TBW ratio, extracellular water to total body water, is one of InBody’s most clinically valuable markers for diabetic patients. InBody gives 0.360 to 0.390 as the normal range for the ECW/TBW ratio.[14] A rising ratio can reflect fluid redistribution, which may accompany chronic low-grade inflammation or organ dysfunction. Diabetic kidney disease develops in approximately 40% of people with diabetes and is the leading cause of chronic kidney disease worldwide.[21] In people with T2DM, a higher ECW/TBW ratio has been associated with greater albuminuria in a cross-sectional study of 1,034 patients,[22] and with faster eGFR decline in a small cohort of 40 patients with diabetic kidney disease.[23] These are observational associations; it has not been shown that ECW/TBW can detect kidney disease before eGFR or urine albumin tests do.
A shift of body water from the intracellular to the extracellular compartment can be measured with InBody BIA. In clinical practice, a T2DM patient whose ECW/TBW ratio is trending upward over serial measurements, even within the normal range, may be worth reviewing with their clinician alongside routine kidney function tests (eGFR and urine albumin), as one possible early clue to fluid overload, kidney involvement, or cardiovascular strain.
KEY INSIGHT
For endocrinologists and diabetologists, ECW/TBW is a non-invasive, point-of-care measurement that can be repeated at every clinic visit. It supplements, and does not replace, uACR and eGFR testing. A rising ECW/TBW trend in a T2DM patient is a reason to check kidney function tests, not a diagnosis of nephropathy.
Secret 6: Body Composition Data Helps You Monitor SGLT-2 Inhibitors and GLP-1 Agonists
SGLT-2 inhibitors and GLP-1 receptor agonists are the most significant pharmacological advances in diabetes treatment in a generation. In cardiovascular outcome trials, SGLT-2 inhibitors reduced hospitalisation for heart failure and slowed the progression of kidney disease in people with type 2 diabetes.[24] GLP-1 receptor agonists drive weight loss alongside glucose reduction. Body composition monitoring can add useful information when these drugs are used.
In a 2026 network meta-analysis of 41 randomised trials, GLP-1 and dual GIP/GLP-1 receptor agonists produced the largest reductions in fat mass but also reduced lean mass (mean differences of −4.40 kg for tirzepatide and −1.54 kg for liraglutide), SGLT-2 inhibitors caused only minor lean mass losses, and exercise reduced the lean mass loss seen with liraglutide.[25] Lean mass effects are not uniform across drugs and trials, so measuring them in the individual patient is useful. Without serial body composition measurement, clinicians cannot tell whether weight loss is coming from fat, which is beneficial, or from lean tissue, which is undesirable in a patient already at risk of sarcopenia. Serial body composition tracking, with InBody or another validated method, is one practical way to check that treatment is producing the right compositional change.
CLINICAL IMPLICATION
InBody’s medical (BWA) division notes that tracking body composition during GLP-1 receptor agonist-induced weight loss has become increasingly needed because of concerns about muscle tissue loss.[26] For T2DM patients on these agents, serial InBody scans (for example every 8–12 weeks) can show whether weight loss is coming from fat rather than muscle. If skeletal muscle mass is declining alongside fat mass, it is worth discussing resistance training and adequate protein intake with the treating clinician or dietitian.
Secret 7: Serial Body Composition Tracking Is a Powerful Motivational Tool in Diabetes Care
The Challenge of Patient Adherence in Diabetes
Patient adherence to lifestyle interventions is one of the biggest challenges in diabetes management. Patients who are told their HbA1c is 8.1% often do not fully understand what that means for their daily health. They cannot see HbA1c, and they cannot feel it improving.
As a result, the number feels abstract and disconnected. This makes it a weak motivational tool, especially when lifestyle changes require consistent daily effort over a long period.
Why HbA1c Alone Fails to Motivate Change
The problem with HbA1c is simple: it is not tangible. Patients do not experience immediate feedback. They do not see visible progress in their day-to-day lives.
Because of this, many people struggle to stay committed. Without clear, visible results, it becomes difficult to maintain motivation for diet, exercise, and other lifestyle interventions.
How Body Composition Data Changes the Game
Body composition data offers a completely different experience. It makes progress visible, measurable, and personal.
For example, when a patient sees their InBody results, the changes are clear. Their visceral fat level may drop from 12 to 9 over 12 weeks, leg lean mass may increase by 1.2 kg, and their body fat percentage may reduce from 33.8% to 29.4%.
These are not abstract numbers. They are specific improvements that patients can understand and relate to. As a result, they feel more motivated to continue their efforts.
Creating a Strong Motivation Loop with InBody
An InBody Europe article on diabetes programmes (a commercial profile published by Open Access Government in 2020) highlights this advantage. It argues that body composition reports show patients what traditional weight scales cannot.[27]
“With a comprehensive body composition report, InBody devices show patients the changes that ordinary weight scales are incapable of showing and provide an educational outline to start a discussion towards lifestyle change.”
In addition, the Body Composition History section tracks progress over time. This creates a continuous feedback loop. Patients can see how their efforts lead to real results, which helps them stay consistent over months and even years.
THE 7 INBODY METRICS THAT TRANSFORM DIABETES MANAGEMENT
1. Visceral Fat Level (VFL): A marker of visceral fat, which is strongly associated with T2DM and is poorly captured by BMI
2. Skeletal Muscle Mass (SMM): Muscle mass underpins glucose disposal capacity, and it can decline in T2DM
3. Skeletal Muscle Index (SMI): Normalised muscle mass helps screen for low muscle mass and sarcopenia in diabetic patients
4. Leg Lean Mass: A large muscle group that matters for glucose uptake and insulin sensitivity
5. Body Fat Percentage: A direct adiposity measure that identified obesity in 39 percentage points more T2DM patients than BMI in one chart review[6]
6. ECW/TBW Ratio: A fluid-balance marker associated with albuminuria and eGFR decline in T2DM studies[22][23]
7. InBody Score: A composite metric that tracks overall body composition change across serial visits
InBody vs HbA1c and BMI Alone: What Each Tells You
| Clinical Question | HbA1c + BMI Alone | HbA1c + BMI + InBody Body Composition |
|---|---|---|
| Is my patient truly obese?[6] | Only 32.4% identified as obese by BMI (Taiwan chart review, 2021) | 71.5% identified as obese by body fat % |
| Why is insulin resistance worsening? | Cannot determine, no fat or muscle data | Identifies visceral fat accumulation, declining SMM, or both simultaneously |
| Is leg muscle mass adequate for glucose disposal? | Cannot assess, as BMI has no limb data | Segmental leg lean mass measurement for an important metabolic tissue |
| Is SGLT-2 inhibitor causing muscle loss? | Cannot detect, only scale weight available | Serial SMM tracking can show fat vs lean tissue changes |
| Are early diabetic complications developing?[22][23] | Detected when blood and urine markers change | Rising ECW/TBW ratio may add an early clue to fluid shifts and kidney involvement |
| Is the patient motivated to continue lifestyle changes? | HbA1c changes slowly, a poor feedback loop. | Serial body composition history provides immediate, specific motivational data |
Case Example: The Patient Who Was Managing Diabetes With the Wrong Treatment Target
Patient Background and Clinical History
A 49-year-old male marketing professional in Hyderabad had been living with Type 2 diabetes for six years. His HbA1c was 7.8%, indicating moderate control but still above the ideal target. With a BMI of 25.3, he would be classed as overweight on the WHO international scale, although the Indian consensus definition already counts a BMI of 25 or above as obesity.[8][28]
His physician had already adjusted his metformin dosage and added a DPP-4 inhibitor. Medication adherence was not an issue, as he followed the treatment plan consistently. However, despite these efforts, his HbA1c had remained above 7.5% for the past 18 months.
Limitations of Traditional Metrics
When a new endocrinologist ordered an InBody scan, a deeper issue became clear. The results revealed what HbA1c and BMI alone had failed to show.
While these traditional markers indicated moderate control, they did not provide insights into fat distribution, muscle mass, or inflammation. As a result, the root cause of poor metabolic control remained hidden.
InBody Scan Findings: The Hidden Problem
The InBody scan highlighted several critical concerns. His Visceral Fat Level was 13, placing him in a high-risk category. In addition, his Skeletal Muscle Mass was 3.1 kg below the expected range for his age and height.
A closer look showed that his leg lean mass was particularly low on both sides. Meanwhile, his Body Fat Percentage stood at 32.4%, which is considered obese based on body composition (the body-fat cut-off used for obesity in Asian Indian men with type 2 diabetes is above 25%).[29] The ECW/TBW ratio was 0.413, above the 0.390 upper limit of InBody’s normal range and possibly reflecting fluid redistribution.
Personalised Intervention Plan
A new management plan was designed based on his body composition data. He was advised to perform resistance training three times per week, with a focus on lower-body exercises.
His protein intake was increased to 1.3 g/kg/day to support muscle growth. In addition, an SGLT-2 inhibitor was introduced, with serial InBody monitoring to ensure fat loss without muscle loss.
Regular InBody scans were scheduled every 8 weeks to track progress and make necessary adjustments.
Follow-Up and Progress (12 Weeks)
At his 12-week review:
| ↓3 units Visceral Fat Level (13 → 10) | +1.8 kg Skeletal Muscle Mass gained | ↓0.7% HbA1c reduction (7.8% → 7.1%) | Normal ECW/TBW ratio at 12 weeks |
His BMI had changed by only 0.6 units. Apart from the SGLT-2 inhibitor added at the start of the plan, his pharmacological regimen had not been modified. The improvement in HbA1c coincided with a gain in muscle and a fall in visceral fat, which fits with increased glucose disposal capacity and reduced insulin resistance, although the SGLT-2 inhibitor and the lifestyle changes may also have contributed. Neither the body composition problem nor its improvement would have been visible from BMI and HbA1c alone.
Frequently Asked Questions
Q. How does body composition affect diabetes?
Body composition is closely linked to diabetes risk and control through two main pathways. First, high visceral fat generates free fatty acids and inflammatory signals that are thought to impair insulin signalling in skeletal muscle, liver, and adipose tissue, contributing to insulin resistance.[11][12] Second, low skeletal muscle mass reduces the body’s main glucose disposal capacity: skeletal muscle takes up approximately 80% of insulin-stimulated glucose under experimental clamp conditions.[4] A patient with high visceral fat and low muscle mass at the same time is likely to carry an unfavourable metabolic profile, regardless of their BMI or scale weight.
Q. What is the relationship between skeletal muscle mass and blood sugar?
Skeletal muscle takes up approximately 80% of insulin-stimulated glucose under experimental clamp conditions.[4] Higher skeletal muscle mass relative to body size is associated with better insulin sensitivity and lower HbA1c in population data.[15] When skeletal muscle mass declines, as it can in people with T2DM, glucose disposal capacity may fall and glycaemic control can worsen.[18] InBody measures leg lean mass and skeletal muscle index (SMI) directly, enabling clinicians to track an important metabolic tissue in diabetes management and discuss targeted resistance training to address any leg muscle deficit.
Q. How does InBody help manage type 2 diabetes?
InBody provides seven body composition metrics relevant to diabetes in under 60 seconds: Visceral Fat Level (a marker of visceral fat, which is strongly associated with T2DM), Skeletal Muscle Mass and SMI (glucose disposal capacity and sarcopenia screening), Leg Lean Mass (a large muscle group important for glucose uptake), Body Fat Percentage (best read against Asian Indian reference values), ECW/TBW Ratio (a fluid-balance marker linked to diabetic complications in observational studies[22][23]), and InBody Score (a composite body composition tracker). These metrics can support personalised diabetes management by highlighting body composition deficits that may contribute to poor glycaemic control, and by showing whether pharmacological and lifestyle interventions are producing the right compositional response.
Key Takeaways
- HbA1c and BMI show the consequences of diabetes. Body composition can help explain what is behind them. Visceral fat is strongly linked to insulin resistance. Skeletal muscle takes up about 80% of insulin-stimulated glucose in clamp studies.[4] Neither is visible on a standard blood panel or weighing scale.
- The 7 secrets: visceral fat’s link to insulin resistance, legs as a key metabolic organ, the diabetes-sarcopenia cycle, BMI misclassification, ECW/TBW as an early clue to complications, medication monitoring, and motivational tracking all converge on one clinical need: direct body composition measurement at every diabetes visit.
- 71.5% of T2DM patients were obese by body fat percentage versus only 32.4% by BMI in a Taiwanese chart review of 2,404 patients.[6] A gap of roughly four in ten patients suggests that BMI alone can hide excess body fat in people with diabetes.
- InBody delivers visceral fat level, skeletal muscle mass, leg lean mass, SMI, body fat percentage, ECW/TBW ratio, and InBody Score in under 60 seconds, providing the complete body composition picture that HbA1c and BMI together cannot deliver.
- Patients on SGLT-2 inhibitors and GLP-1 receptor agonists may benefit from serial InBody scans (for example every 8–12 weeks) to check that medication-driven weight loss is coming from fat rather than lean tissue.
- Body composition data can be a powerful motivational tool in diabetes care, providing the specific, personal, visual feedback that HbA1c alone cannot deliver, and helping sustain adherence across the months and years required to improve metabolic health.
Defeat Diabetes With Data, Not Guesswork
InBody body composition analysis provides the visceral fat, muscle mass, and fluid data that can add to HbA1c and BMI in every diabetes management plan, in under 60 seconds. Used across endocrinology clinics, diabetes centres, and corporate wellness programmes across India.

Find an InBody Scanner Near You
References
- Anjana RM, Unnikrishnan R, Deepa M, Pradeepa R, Tandon N, Das AK, et al; ICMR-INDIAB Collaborative Study Group. Metabolic non-communicable disease health report of India: the ICMR-INDIAB national cross-sectional study (ICMR-INDIAB-17). Lancet Diabetes Endocrinol. 2023;11(7):474-489. PubMed · DOI
- Mohan V. Lessons learned from epidemiology of type 2 diabetes in South Asians: Kelly West Award Lecture 2024. Diabetes Care. 2025;48(2):153-163. (Reports the ICMR-INDIAB estimate of about 101 million people with diabetes in India in 2021.) PubMed · DOI
- International Diabetes Federation. IDF Diabetes Atlas, 11th edition (2025): Diabetes around the world in 2024, global factsheet (country table: China 148.0 million and India 89.8 million adults aged 20-79 with diabetes in 2024). Brussels: IDF; 2025. IDF factsheet (PDF)
- DeFronzo RA, Tripathy D. Skeletal muscle insulin resistance is the primary defect in type 2 diabetes. Diabetes Care. 2009;32(Suppl 2):S157-S163. PubMed · DOI
- Gupta P, Lanca C, Gan ATL, Soh P, Thakur S, Tao Y, et al. The association between body composition using dual energy X-ray absorptiometry and type-2 diabetes: a systematic review and meta-analysis of observational studies. Sci Rep. 2019;9(1):12634. PubMed · DOI
- Lin CL, Yu NC, Wu HC, Lee YY, Lin WC, Chiu IY, et al. Association of body composition with type 2 diabetes: a retrospective chart review study. Int J Environ Res Public Health. 2021;18(9):4421. (Taiwanese cohort, n=2,404.) PubMed · DOI
- National Institute of Diabetes and Digestive and Kidney Diseases (NIDDK). The A1C Test & Diabetes. National Institutes of Health, USA. niddk.nih.gov
- WHO Expert Consultation. Appropriate body-mass index for Asian populations and its implications for policy and intervention strategies. Lancet. 2004;363(9403):157-163. PubMed · DOI
- Deurenberg P, Deurenberg-Yap M, Guricci S. Asians are different from Caucasians and from each other in their body mass index/body fat per cent relationship. Obes Rev. 2002;3(3):141-146. PubMed · DOI
- Lear SA, Humphries KH, Kohli S, Chockalingam A, Frohlich JJ, Birmingham CL. Visceral adipose tissue accumulation differs according to ethnic background: results of the Multicultural Community Health Assessment Trial (M-CHAT). Am J Clin Nutr. 2007;86(2):353-359. PubMed · DOI
- Ibrahim MM. Subcutaneous and visceral adipose tissue: structural and functional differences. Obes Rev. 2010;11(1):11-18. PubMed · DOI
- Samuel VT, Shulman GI. Mechanisms for insulin resistance: common threads and missing links. Cell. 2012;148(5):852-871. PubMed · DOI
- Kadowaki T, Yamauchi T, Kubota N, Hara K, Ueki K, Tobe K. Adiponectin and adiponectin receptors in insulin resistance, diabetes, and the metabolic syndrome. J Clin Invest. 2006;116(7):1784-1792. PubMed · DOI
- InBody Co., Ltd. Result Sheet Interpretation: parameter keynote (ECW ratio normal range 0.360 to 0.390; Visceral Fat Level 10 and above; visceral fat area cut-off 100 cm²). InBody research site; manufacturer documentation, not peer-reviewed. research.inbody.com
- Srikanthan P, Karlamangla AS. Relative muscle mass is inversely associated with insulin resistance and prediabetes. Findings from the third National Health and Nutrition Examination Survey. J Clin Endocrinol Metab. 2011;96(9):2898-2903. PubMed · DOI
- Garcia SP, Cureau FV, Iorra FQ, Bottino LG, Monteiro LER, Leivas G, et al. Effects of exercise training and physical activity advice on HbA1c in people with type 2 diabetes: a network meta-analysis of randomized controlled trials. Diabetes Res Clin Pract. 2025;221:112027. PubMed · DOI
- Kalra S, Shaikh IA, Shende S, Kapoor N, Unnikrishnan AG, Sharma OP, et al. An Indian consensus on sarcopenia: epidemiology, etiology, clinical impact, screening, and therapeutic approaches. Int J Gen Med. 2025;18:1731-1745. PubMed · DOI
- Mesinovic J, Zengin A, De Courten B, Ebeling PR, Scott D. Sarcopenia and type 2 diabetes mellitus: a bidirectional relationship. Diabetes Metab Syndr Obes. 2019;12:1057-1072. PubMed · DOI
- Castillo ÍMP, Argilés JM, Rueda R, Ramírez M, Pedrosa JML. Skeletal muscle atrophy and dysfunction in obesity and type-2 diabetes mellitus: myocellular mechanisms involved. Rev Endocr Metab Disord. 2025;26(5):815-836. PubMed · DOI
- McLester CN, Nickerson BS, Kliszczewicz BM, McLester JR. Reliability and agreement of various InBody body composition analyzers as compared to dual-energy X-ray absorptiometry in healthy men and women. J Clin Densitom. 2020;23(3):443-450. PubMed · DOI
- Alicic RZ, Rooney MT, Tuttle KR. Diabetic kidney disease: challenges, progress, and possibilities. Clin J Am Soc Nephrol. 2017;12(12):2032-2045. PubMed · DOI
- Yang A, Yu X, Fan Z, Jin Y, Sun F, Wang X, et al. The association between the extracellular water-to-total body water ratio and albuminuria in Chinese type 2 diabetes mellitus patients. PeerJ. 2025;13:e19780. PubMed · DOI
- Miyamoto S, Imaishi N, Morita M, Uchida H, Yamazaki Y, Osue M, et al. Association between extracellular-to-total body water ratio and eGFR decline in diabetic kidney disease: a longitudinal cohort study. Clin Exp Nephrol. 2026;30(10):1457-1467. PubMed · DOI
- Zelniker TA, Wiviott SD, Raz I, Im K, Goodrich EL, Bonaca MP, et al. SGLT2 inhibitors for primary and secondary prevention of cardiovascular and renal outcomes in type 2 diabetes: a systematic review and meta-analysis of cardiovascular outcome trials. Lancet. 2019;393(10166):31-39. PubMed · DOI
- Rakhsha SS, Shahinfar H, Ebrahimi-Mousavi S, Kosari A, Aali Y, Mirzababaei A, et al. Comparative effects of antidiabetic drugs on body composition: a systematic review and network meta-analysis. Diabetes Obes Metab. 2026;28(9):7689-7704. PubMed · DOI
- Bonner J. GLP-1 Therapies and Risk of Muscle Loss. InBody BWA blog, 26 August 2025. Manufacturer blog, not peer-reviewed. inbodybwa.com
- Lee R (InBody Europe). Why is body composition analysis an effective tool for diabetes programmes? Open Access Government, 14 April 2020. Commercial profile written by InBody Europe, not peer-reviewed. openaccessgovernment.org
- Misra A, Chowbey P, Makkar BM, Vikram NK, Wasir JS, Chadha D, et al. Consensus statement for diagnosis of obesity, abdominal obesity and the metabolic syndrome for Asian Indians and recommendations for physical activity, medical and surgical management. J Assoc Physicians India. 2009;57:163-170. PubMed
- Vikram NK, Misra A, Pandey RM, Dudeja V, Sinha S, Ramadevi J, et al. Anthropometry and body composition in northern Asian Indian patients with type 2 diabetes: receiver operating characteristics (ROC) curve analysis of body mass index with percentage body fat as standard. Diabetes Nutr Metab. 2003;16(1):32-40. PubMed

Most trending articles
Student Fitness Screening in India: A Guide for Schools
CBSE HPE, Fit India and Khelo India rely on BMI. How schools and colleges can add body composition screening safely, with child caveats and DPDP consent.
Creatine and Your Body Composition Scan: What Changes
Creatine raises body water and lean mass readings within a week on BIA and DXA. What the studies show and how to time your scans to read progress honestly.
Fitness Testing and Body Composition for Sports Academies
A practical fitness testing battery for Indian sports academies: body composition, grip, jumps, sprints, Yo-Yo, Khelo India context and youth maturation.