
Body Composition 16 min read
Body Recomposition: How to Build Muscle and Lose Fat at the Same Time
You can train consistently and eat enough protein, yet still fail to build muscle. The reason may be invisible on the scale. It may not show up in…
Reading about body composition? Find an InBody test centre near you →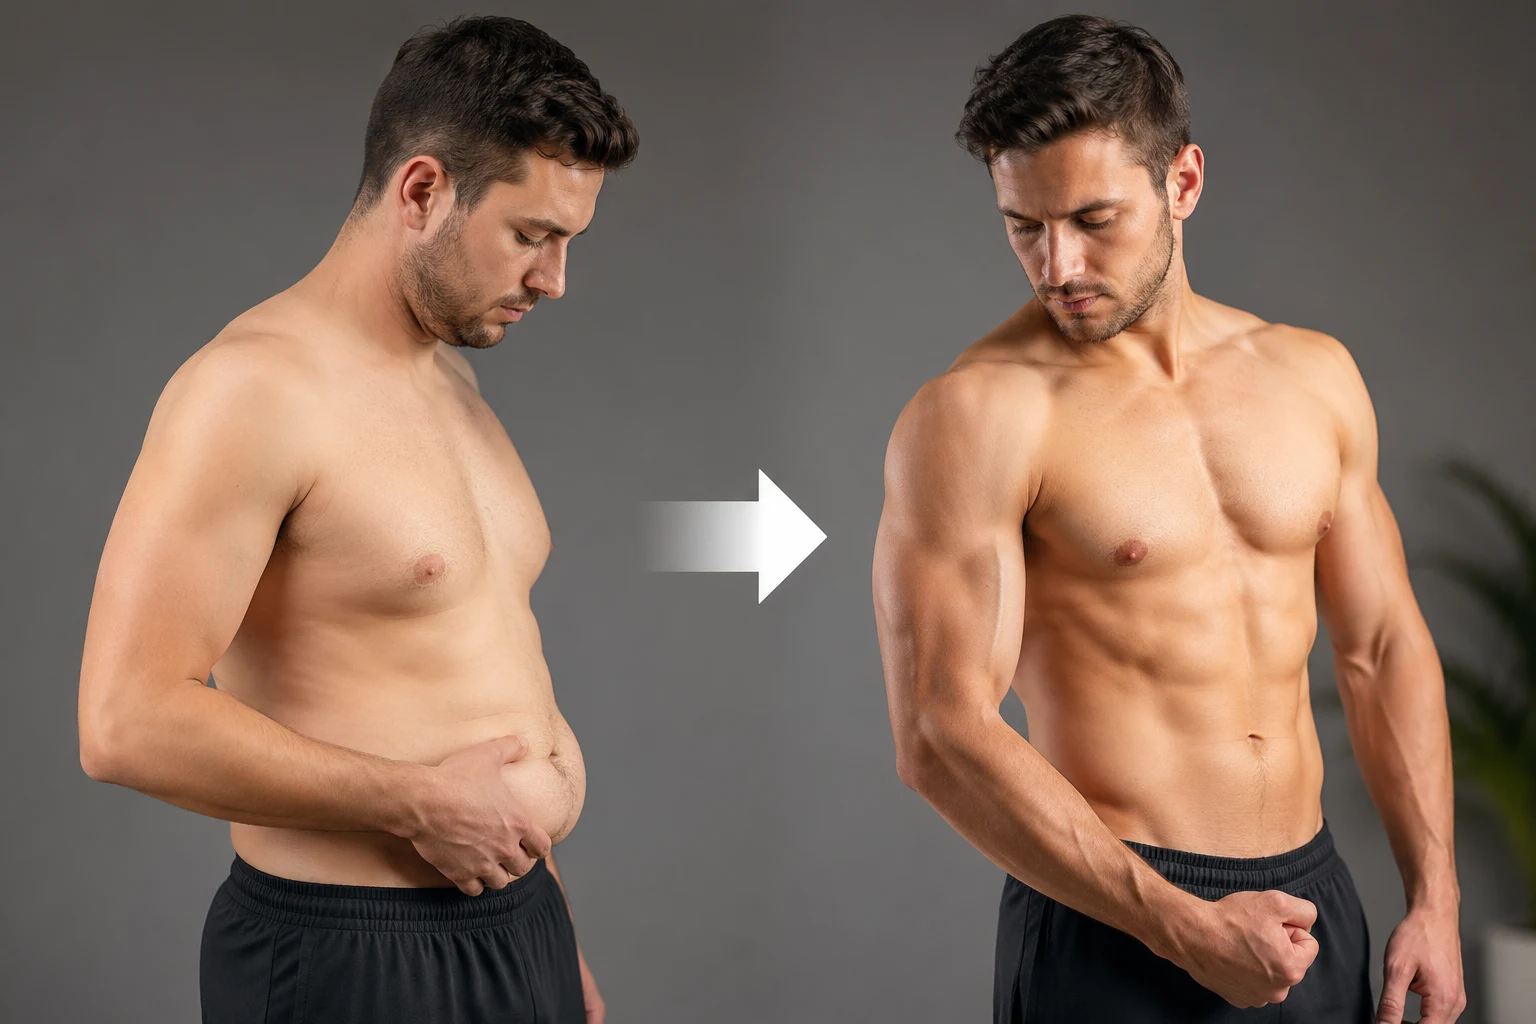
You can train consistently and eat enough protein, yet still fail to build muscle. The reason may be invisible on the scale. It may not show up in your BMI. Meanwhile, it can silently increase even while your fitness tracker says everything is on track. Hidden body fat, particularly visceral fat and intramuscular fat, does not just sit passively in your body. It can work against muscle growth through several biochemical mechanisms.[1][2]
These processes are linked to increased insulin resistance and impaired muscle signalling.
They are also linked to disrupted anabolic hormones and fat infiltrating muscle tissue.
This is the clinical reality of sarcopenic obesity, one of the harder-to-spot body composition phenotypes in India.[3]
A person can carry high visceral and intramuscular fat while appearing lean and maintaining a “healthy” BMI.[4] Meanwhile, hidden fat can degrade the metabolic environment that muscle growth requires. This article explains 7 key mechanisms through which hidden fat blocks muscle growth.
It also shows how InBody analysis detects these risks early.
| ↑VFA predicts ↓lean mass In the prospective KSOS cohort, baseline visceral fat area independently predicted a later decline in appendicular lean mass over about 27.6 months (PLOS ONE)[5] | 2.4x Higher adjusted odds of sarcopenic obesity in Indian adults with type 2 diabetes than in those without diabetes (cross-sectional study, n=750)[6] | ~80% Of insulin-stimulated glucose uptake takes place in skeletal muscle, a tissue strongly affected by fat-driven insulin resistance[7] | 60 sec Time for InBody to deliver visceral fat level, body fat %, skeletal muscle mass, phase angle and ECW/TBW the complete fat-muscle picture |
Why Your Scale and BMI Cannot See This Problem
The scale measures one number: total mass. It cannot distinguish fat from muscle. BMI cannot detect visceral fat, intramuscular fat, or segmental fat distribution.
A person may have 34% body fat, Visceral Fat Level 12, and low muscle mass yet still show a BMI of 23.5, which falls in the normal range on the standard WHO scale (below 25).[8]
The Indian thin-fat phenotype, low muscle mass with preserved body fat, has been described from birth in Indian babies and can make this problem especially relevant.[9] Asian populations tend to have higher body fat at the same BMI compared to Western populations.[10]
This can include more visceral fat[11] and, in some groups, lower muscularity.
As a result, individuals may train hard but remain in a fat-driven inflammatory state that works against muscle growth.
THE SCALE TRAP FOR MUSCLE BUILDERS
The Korean Sarcopenic Obesity Study (KSOS) prospectively followed 379 adults for about 27.6 months. Even without significant changes in weight or BMI, appendicular lean mass declined. At the same time, trunk and total fat mass increased in both men and women.[5] Weight stability is not body composition stability. Without body composition analysis, these changes can go unnoticed. By the time they are detected clinically, significant muscle loss may already have occurred. Learn more about why BMI and weight miss body composition changes.

Mistake 1: Ignoring Visceral Fat: The Inflammatory Engine Destroying Muscle Protein Synthesis
Visceral fat is not metabolically passive. Adipose tissue is an endocrine organ that secretes adipokines such as tumour necrosis factor-alpha (TNF-α), interleukin-6 (IL-6), leptin, and adiponectin, and in obesity this balance becomes dysregulated.[1][2] Inflammatory signals like TNF-α and IL-6 are linked to impaired insulin signalling, muscle wasting, and reduced muscle-building (myogenic) activity.[1][2]
A 2025 narrative review in the Journal of Cachexia, Sarcopenia and Muscle described how adipose tissue and lipid metabolites influence skeletal muscle. Adipokines such as TNF-α, IL-6, and adiponectin influence insulin sensitivity and inflammation in muscle.[1] A prospective cohort study also found that higher visceral fat predicted later loss of lean mass.[5]
CLINICAL IMPLICATION
If visceral fat is elevated, muscle-building may be fighting an active biochemical headwind rather than a neutral environment. A person with high visceral fat may train in a chronic low-grade inflammatory state. This environment can dampen muscle-building signals. InBody helps estimate visceral fat and can set a clear first target: reduce visceral fat.
Mistake 2: Underestimating Insulin Resistance: The Anabolic Blocker Hidden in Body Fat
Insulin is a pivotal anabolic signal. After exercise, insulin helps muscles absorb amino acids and build protein. It also reduces breakdown and restores glycogen. When excess visceral and intramuscular fat drives insulin resistance, these anabolic mechanisms can be impaired together.[2] The muscle-building signal of a resistance training session may be partly blunted before it reaches the muscle cell.
Skeletal muscle handles approximately 80% of insulin-stimulated glucose uptake under controlled clamp conditions.[7] With insulin resistance, this process weakens. Muscles may also respond less well to protein intake, which can limit muscle growth despite proper nutrition. Excess body fat can effectively tax the returns on protein intake and on every resistance training session completed.
KEY INSIGHT
A 2020 narrative review in Frontiers in Endocrinology described insulin resistance as one of the pathways linking obesity and sarcopenia. Fat deposited in muscle can disrupt signalling and cause cellular stress.[2] InBody metrics like ECW/TBW ratio and phase angle may help flag related changes in muscle quality and fluid distribution.[12][13]
Mistake 3: Missing the Hormonal Disruption That Comes With Excess Fat
Excess body fat, particularly abdominal fat, is associated with disruption of major anabolic hormones. These include growth hormone, testosterone, and IGF-1. Each of these supports muscle protein synthesis, muscle satellite cell activation, and muscle fibre hypertrophy, so disruption can make muscle gain harder.
Obesity, particularly abdominal obesity, is associated with reduced growth hormone secretion.[14] In men, low testosterone is associated with greater fat mass and lower lean mass, and the relationship between testosterone and obesity runs in both directions.[15] Pro-inflammatory cytokines can also blunt the anabolic action of IGF-1, which has been linked to frailty in older men.[2] Together, these changes can weaken the body’s ability to build and keep muscle.
THE HORMONAL IMPLICATIONS FOR INDIAN FITNESS AND CLINICAL SETTINGS
In India, hormonal issues are often investigated through blood reports. However, the underlying visceral fat is not always measured. InBody can show how much visceral fat is present, one possible contributor to poor muscle growth outcomes.
Mistake 4: Overlooking Myosteatosis: Fat Infiltrating the Muscle Itself
Myosteatosis, fat infiltration into and between skeletal muscle fibres, is an important yet under-discussed consequence of excess body fat. When lipid accumulates within muscle tissue as intramuscular and intermuscular fat, it does not just occupy space. It disrupts muscle function through several mechanisms, including impaired mitochondrial fatty acid oxidation, increased lipolysis, oxidative stress, and lipotoxic damage to insulin signalling.[2]
A 2025 Journal of Cachexia, Sarcopenia and Muscle review reported that intracellular lipid droplets can disrupt muscle physiology. Their impact depends on size, location, and characteristics.[1] A Frontiers in Endocrinology review described impaired mitochondrial fatty acid oxidation, higher oxidative stress, and reduced muscle fibre contractility.[2] A 2024 Scientific Reports cross-sectional study of 156 older women found that those with sarcopenic obesity had lower muscle-specific strength and poorer physical performance than those with obesity or sarcopenia alone.[16]
THE MYOSTEATOSIS DETECTION CHALLENGE
Myosteatosis is not visible in routine assessments like weight, gym performance, or blood tests. InBody’s phase angle, a BIA-derived marker related to cellular membrane integrity, offers an indirect signal of muscle quality. A 2024 meta-analysis found a moderate correlation between phase angle and muscle radiodensity (a CT marker of fat infiltration), although the certainty of the evidence was low.[13] A study of 424 Japanese adults aged 50 or older likewise found that leg phase angle was independently associated with a CT index of myosteatosis.[17] A declining phase angle despite stable muscle mass may therefore point to worsening muscle quality, which can be useful when planning resistance training and dietary intervention.
Mistake 5: Failing to Recognise Sarcopenic Obesity as a Vicious Cycle
Sarcopenic obesity is not a static condition. It is thought to be a self-reinforcing vicious cycle.[18] Visceral fat accumulation is thought to drive inflammatory and hormonal disruptions that suppress muscle protein synthesis and promote muscle catabolism. As skeletal muscle mass declines, the body’s largest glucose disposal site shrinks. This can worsen insulin resistance and promote further fat accumulation. Fat accumulates further, inflammatory cytokines increase, and muscle catabolism accelerates. The cycle tightens.
The KSOS prospective study examined whether visceral fat or muscle loss comes first. Baseline visceral fat area predicted later loss of lean mass, whereas baseline lean mass did not significantly predict later change in visceral fat.[5] This suggests that visceral fat reduction may be an important entry point for breaking this cycle, alongside muscle-building exercise. Resistance training alone may not be enough if visceral fat remains high. It can be like building muscle in a hostile biochemical environment.
KEY INSIGHT
A 2023 Metabolism review described how adipokines and myokines interact to regulate metabolic homeostasis and muscle regeneration. Excess adiposity creates pro-inflammatory conditions that can disrupt this balance and impede muscle tissue regeneration.[18] InBody tracking of visceral fat and muscle mass can help monitor these changes over time.
Mistake 6: Trusting Weight Loss Without Confirming Muscle Is Being Preserved
This is the mistake that directly sabotages muscle growth through intervention. Caloric restriction alone does not selectively reduce fat. It leads to both fat and muscle loss, although adequate protein and exercise, especially resistance training, help preserve muscle.[19] The proportion depends on diet, protein intake, training, and hormones. A 2026 expert-opinion article in Obesity and Endocrinology noted that with incretin-based weight-loss drugs, up to about 40% of the weight lost can be lean soft tissue, although the clinical significance of this loss has not been established.[20] A 2026 meta-analysis of 20 randomised trials found that lean mass made up roughly 25–39% of the weight lost with semaglutide, tirzepatide, and liraglutide, a similar share to lifestyle interventions (about 26%) and lower (about 18%) when resistance training was added.[21]
Clinically, a person losing 8 kg may lose about 2 kg of muscle and 6 kg of fat. Their body weight has decreased, BMI looks better, and the scale confirms progress. This is critical because muscle drives glucose metabolism and metabolic rate. Losing muscle can weaken long-term metabolic health. This is not true fat loss success. It can be sarcopenic obesity in slow motion. And it stays invisible on the scale and BMI unless body composition is measured, for example with InBody.
THE FAT LOSS TRAP AND HOW INBODY PREVENTS IT
The best way to confirm fat loss while preserving muscle is to measure both regularly. InBody tracks body fat percentage and skeletal muscle mass at every scan. This helps professionals monitor whether fat loss is effective and safe. Without this data, “successful” weight loss may be actively worsening the sarcopenic obesity phenotype it was intended to reverse.
Mistake 7: Not Measuring Body Composition: The Foundation of Every Muscle-Building Decision
The biggest mistake is making decisions without body composition data. Without knowing visceral fat, body fat %, and muscle distribution, decisions rely on guesswork.
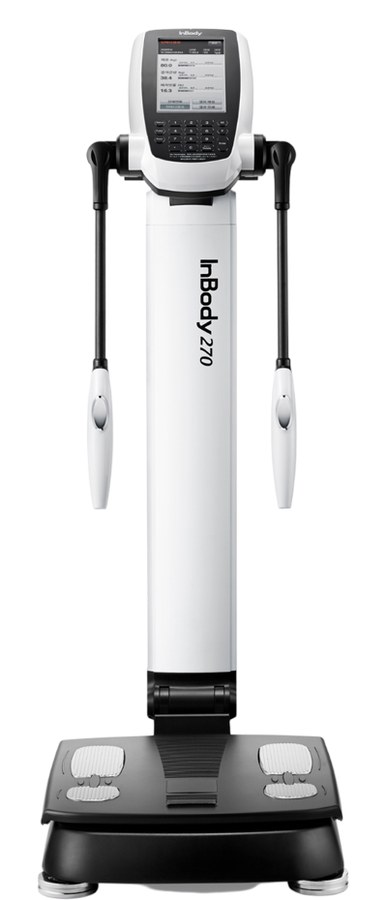
InBody provides the six body composition metrics that make these assumptions unnecessary. Visceral fat level shows whether visceral fat, a likely inflammatory driver of muscle loss, is being addressed. Skeletal muscle mass per limb confirms whether training is producing muscle growth and in which specific limbs. Body fat percentage confirms whether fat management is succeeding independently of total weight. ECW/TBW ratio shows shifts in fluid distribution that can accompany frailty or poorer muscle health.[12] Phase angle offers an indirect indication of cellular health and muscle quality.[13] InBody Score tracks the overall trajectory of body composition quality over time.
WHY MEASUREMENT-GUIDED TRACKING HELPS
A likely reason is that specific, objective, personal data can motivate specific, sustained behaviour change. When clients see visceral fat drop, muscle increase, and body fat decrease even with minimal weight change, progress becomes clear and motivating. That data builds the adherence that builds the muscle.
What InBody Measures to Reveal the Hidden Fat-Muscle Relationship
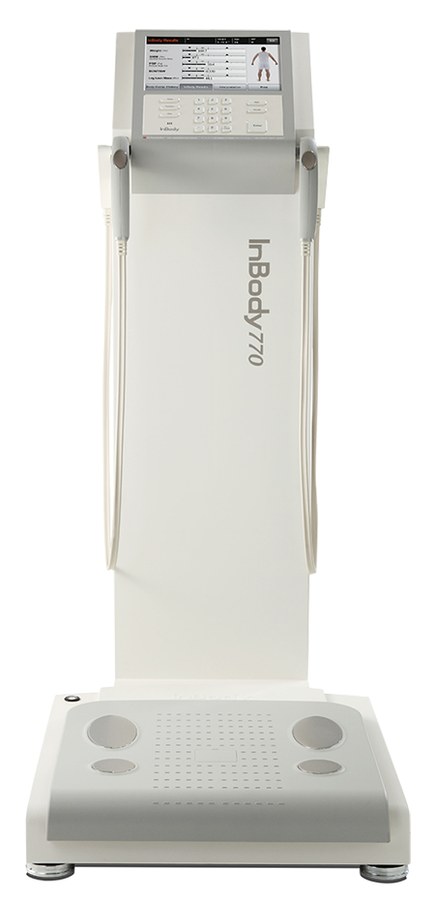
Each InBody scan provides key metrics in under 60 seconds, without radiation or blood tests.
| InBody Metric | What It Measures | Why It Matters for Muscle Growth |
|---|---|---|
| Visceral Fat Level (VFL) | Fat surrounding internal organs, on a 1 to 20 scale | A major source of inflammatory signals that can hinder muscle protein synthesis. Tracking and reducing VFL may help resistance training work more efficiently |
| Body Fat Percentage | Total fat mass as % of body weight | Confirms whether fat-loss interventions are succeeding independently of scale weight changes that may mask muscle loss alongside fat loss |
| Skeletal Muscle Mass (SMM) | Lean muscle mass in kg per limb and trunk | The primary outcome metric for any muscle-building programme. Must be tracked to confirm training is producing hypertrophy and not just weight stability |
| Segmental Lean Analysis | Muscle mass in each limb (right/left arm, right/left leg) and trunk | Identifies muscle imbalances and limb-specific deficits, enabling targeted exercise prescription for specific underdeveloped muscle groups |
| ECW/TBW Ratio[12] | Extracellular to total body water ratio | Reflects how body water is distributed; higher values are associated with frailty and poorer health status. A rising ECW/TBW in a client not gaining muscle is a prompt to look for causes such as inflammation, fluid shifts, or reduced muscle quality |
| Phase Angle[13] | BIA-derived marker of cellular membrane integrity | Indirect marker of muscle quality, including fat infiltration of muscle (myosteatosis). A declining phase angle despite stable SMM may reflect falling muscle quality |
Real Case: The Trainer Who Was Building Fat While Trying to Build Muscle
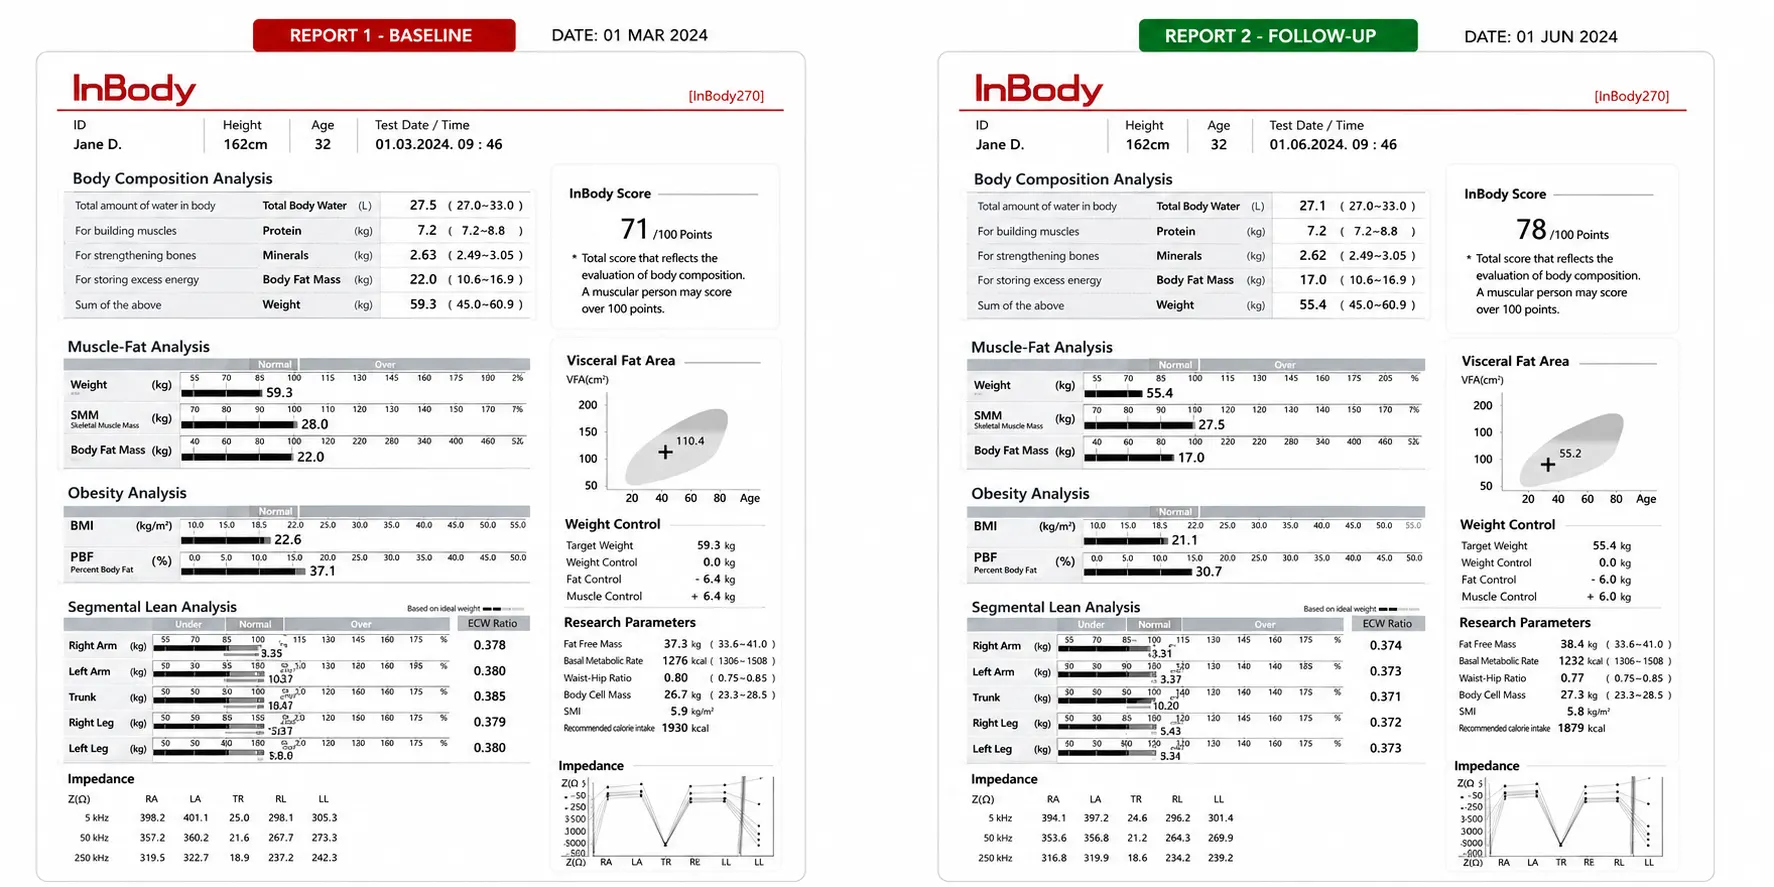
A 31-year-old male marketing professional in Delhi had been training at a gym five days per week for 18 months. He ate a high-protein diet averaging 140 g of protein daily. His scale weight had increased by 3.2 kg over those 18 months, which he attributed to muscle gain. His BMI was 25.1. He reported fatigue, slower performance, and stalled strength despite consistent training.
His first InBody scan told a completely different story. Visceral Fat Level: 11 (high risk threshold). Body Fat Percentage: 27.4% (high for his age and gender).[22] Skeletal Muscle Mass: only 0.4 kg above baseline population norm despite 18 months of consistent resistance training. Phase Angle: 5.1°, below the reference value for his demographic. ECW/TBW ratio: 0.384, toward the upper end of the usual range. His segmental lean analysis showed both legs significantly below the recommended range for his height and weight.
At his 12-week follow-up, InBody scan:
| ↓3 units Visceral Fat Level (11 → 8) | +2.1 kg Skeletal Muscle Mass gained | ↑0.4° Phase Angle improvement (5.1° → 5.5°) | ↓3.8% Body Fat Percentage reduced |
His scale weight changed by less than 0.5 kg. His strength hit new personal records in all major compound movements within 10 weeks. Without InBody data, he might have continued ineffective efforts for months.
Frequently Asked Questions
Q. How does hidden body fat sabotage muscle growth?
Hidden (especially visceral) fat is linked to harm to muscle growth through inflammation (TNF-α, IL-6), insulin resistance, hormonal disruption, myosteatosis, mitochondrial dysfunction, and reduced IGF-1 signalling, which together may create a vicious cycle of muscle loss and fat gain.[2] InBody measures visceral fat, skeletal muscle mass, ECW/TBW ratio, and phase angle in under 60 seconds.
Q. What is sarcopenic obesity and how common is it in India?
Sarcopenic obesity is the coexistence of high body fat and low muscle mass, a condition linked to higher cardiometabolic risk.[2] Indians tend to carry more body fat at a given BMI, so it can occur at lower BMI levels.[10] According to the Indian Consensus on Sarcopenia (2025), the reported prevalence of primary sarcopenia in Indian adults ranges from 14.2% to 39.2%, and all patients with comorbidities such as diabetes should be screened.[3] In an Indian cross-sectional study of 750 adults, type 2 diabetes was associated with about 2.4-fold higher adjusted odds of sarcopenic obesity.[6] Tracking fat and muscle together, for example with InBody, can help monitor this.
Q. Can you gain muscle and have too much body fat at the same time?
Yes. Muscle can increase while excess body fat remains, and the opposite pattern also occurs: in sarcopenic obesity, fat mass increases while muscle mass declines, even if body weight or BMI appears stable. In the KSOS cohort, lean mass fell and fat mass rose over about 27.6 months despite no significant change in weight or BMI.[5] Tools that track both muscle and fat, such as InBody or DXA, can reveal whether true muscle gain is happening or hidden fat gain is masking progress.
Key Takeaways
- Hidden fat, especially visceral fat, damages muscle through multiple pathways. These include inflammation, insulin resistance, hormonal imbalance, myosteatosis, mitochondrial dysfunction, and poor fat-loss strategies.
- The KSOS study found that higher visceral fat was associated with future loss of lean mass, even though weight and BMI did not change significantly.[5]
- Sarcopenic obesity, high fat and low muscle at a “healthy” BMI, deserves particular attention in Indian adults, who tend to carry more body fat at a given BMI.[10] In an Indian cross-sectional study, type 2 diabetes was associated with about 2.4-fold higher adjusted odds of sarcopenic obesity.[6]
- Myosteatosis, intramuscular fat infiltration, can reduce muscle quality and contractile force beyond what muscle mass alone shows.[2] In a study of older women, those with sarcopenic obesity showed lower muscle-specific strength than those with either sarcopenia or obesity alone (Scientific Reports 2024).[16]
- Weight loss without resistance training and adequate protein tends to cost more muscle.[19] Lean mass has been estimated at roughly 25–39% of the weight lost on incretin drugs and about 26% with lifestyle weight loss alone.[21] Body composition tracking, such as InBody, shows whether fat loss is occurring alongside muscle preservation.
- InBody provides six key metrics in under 60 seconds: visceral fat level, body fat %, skeletal muscle mass per limb, ECW/TBW ratio, phase angle, and InBody score.
Stop Training Blind See What Hidden Body Fat Is Doing to Your Muscles
An InBody scan reveals hidden fat, muscle distribution, and cellular health. It shows whether fat is impairing muscle and what actions to take.

Find an InBody Scanner Near You
References
- Jang SY, Choi KM. Impact of adipose tissue and lipids on skeletal muscle in sarcopenia. J Cachexia Sarcopenia Muscle. 2025;16(4):e70000. PubMed · DOI
- Roh E, Choi KM. Health consequences of sarcopenic obesity: a narrative review. Front Endocrinol (Lausanne). 2020;11:332. PubMed · DOI
- Kalra S, Shaikh IA, Shende S, et al. An Indian consensus on sarcopenia: epidemiology, etiology, clinical impact, screening, and therapeutic approaches. Int J Gen Med. 2025;18:1731-1745. PubMed · DOI
- Sahakyan KR, Somers VK, Rodriguez-Escudero JP, et al. Normal-weight central obesity: implications for total and cardiovascular mortality. Ann Intern Med. 2015;163(11):827-835. PubMed · DOI
- Kim TN, Park MS, Ryu JY, et al. Impact of visceral fat on skeletal muscle mass and vice versa in a prospective cohort study: the Korean Sarcopenic Obesity Study (KSOS). PLoS One. 2014;9(12):e115407. PubMed · DOI
- Yogesh M, Patel MG, Makwana HH, Kalariya H. Unraveling the enigma of sarcopenia and sarcopenic obesity in Indian adults with type 2 diabetes – a comparative cross-sectional study. Clin Diabetes Endocrinol. 2024;10(1):22. PubMed · DOI
- DeFronzo RA, Tripathy D. Skeletal muscle insulin resistance is the primary defect in type 2 diabetes. Diabetes Care. 2009;32(Suppl 2):S157-S163. PubMed · DOI
- WHO Expert Consultation. Appropriate body-mass index for Asian populations and its implications for policy and intervention strategies. Lancet. 2004;363(9403):157-163. PubMed · DOI
- Yajnik CS, Fall CH, Coyaji KJ, et al. Neonatal anthropometry: the thin-fat Indian baby. The Pune Maternal Nutrition Study. Int J Obes Relat Metab Disord. 2003;27(2):173-180. PubMed
- Deurenberg P, Deurenberg-Yap M, Guricci S. Asians are different from Caucasians and from each other in their body mass index/body fat per cent relationship. Obes Rev. 2002;3(3):141-146. PubMed · DOI
- Lear SA, Humphries KH, Kohli S, et al. Visceral adipose tissue accumulation differs according to ethnic background: results of the Multicultural Community Health Assessment Trial (M-CHAT). Am J Clin Nutr. 2007;86(2):353-359. PubMed · DOI
- Tanaka S, Ando K, Kobayashi K, et al. Higher extracellular water-to-total body water ratio more strongly reflects the locomotive syndrome risk and frailty than sarcopenia. Arch Gerontol Geriatr. 2020;88:104042. PubMed · DOI
- Costa Pereira JPD, Rebouças AS, Prado CM, et al. Phase angle as a marker of muscle quality: a systematic review and meta-analysis. Clin Nutr. 2024;43(12):308-326. PubMed · DOI
- Makimura H, Feldpausch MN, Rope AM, et al. Metabolic effects of a growth hormone-releasing factor in obese subjects with reduced growth hormone secretion: a randomized controlled trial. J Clin Endocrinol Metab. 2012;97(12):4769-4779. PubMed · DOI
- Kelly DM, Jones TH. Testosterone and obesity. Obes Rev. 2015;16(7):581-606. PubMed · DOI
- da Costa Teixeira LA, Soares LA, da Fonseca SF, et al. Analysis of body composition, functionality and muscle-specific strength of older women with obesity, sarcopenia and sarcopenic obesity: a cross-sectional study. Sci Rep. 2024;14(1):24802. PubMed · DOI
- Kato M, Okada Y, Nakano W, et al. Bioimpedance phase angle is independently associated with myosteatosis: the Shizuoka study. Clin Nutr. 2023;42(5):793-799. PubMed · DOI
- Park MJ, Choi KM. Interplay of skeletal muscle and adipose tissue: sarcopenic obesity. Metabolism. 2023;144:155577. PubMed · DOI
- Cava E, Yeat NC, Mittendorfer B. Preserving healthy muscle during weight loss. Adv Nutr. 2017;8(3):511-519. PubMed · DOI
- Conte C. Muscle-preserving therapies in the era of pharmacological weight loss (expert opinion). Obes Endocrinol. 2026;2(1):wjaf020. DOI
- Eisa N, Barood O. Lean mass changes with incretin therapy versus lifestyle intervention: a systematic review and meta-analysis of randomised controlled trials. Diabetes Obes Metab. 2026;28(6):4818-4827. PubMed · DOI
- Gallagher D, Heymsfield SB, Heo M, et al. Healthy percentage body fat ranges: an approach for developing guidelines based on body mass index. Am J Clin Nutr. 2000;72(3):694-701. PubMed · DOI

Most trending articles
Student Fitness Screening in India: A Guide for Schools
CBSE HPE, Fit India and Khelo India rely on BMI. How schools and colleges can add body composition screening safely, with child caveats and DPDP consent.
Creatine and Your Body Composition Scan: What Changes
Creatine raises body water and lean mass readings within a week on BIA and DXA. What the studies show and how to time your scans to read progress honestly.
Fitness Testing and Body Composition for Sports Academies
A practical fitness testing battery for Indian sports academies: body composition, grip, jumps, sprints, Yo-Yo, Khelo India context and youth maturation.