
Body Composition 13 min read
Body Composition Analysis: The Complete Guide to Results, Testing & Costs in India
Body composition analysis measures what your body is actually made of — fat, muscle, water, and bone — instead of just how much it weighs. A single scan…
Reading about body composition? Find an InBody test centre near you →
Body composition analysis measures what your body is actually made of — fat, muscle, water, and bone — instead of just how much it weighs. A single scan delivers 20 to 30 clinical measurements in under 60 seconds, with no needles and no radiation, which is why it has quietly replaced BMI as the trusted health metric in hospitals, clinics, and gyms across India.
For decades, the Body Mass Index (BMI) was the default screening tool because it needs nothing more than a scale and a measuring tape. But BMI cannot tell you what your weight is made of — and for a large share of India’s population, that gap hides real metabolic risk.
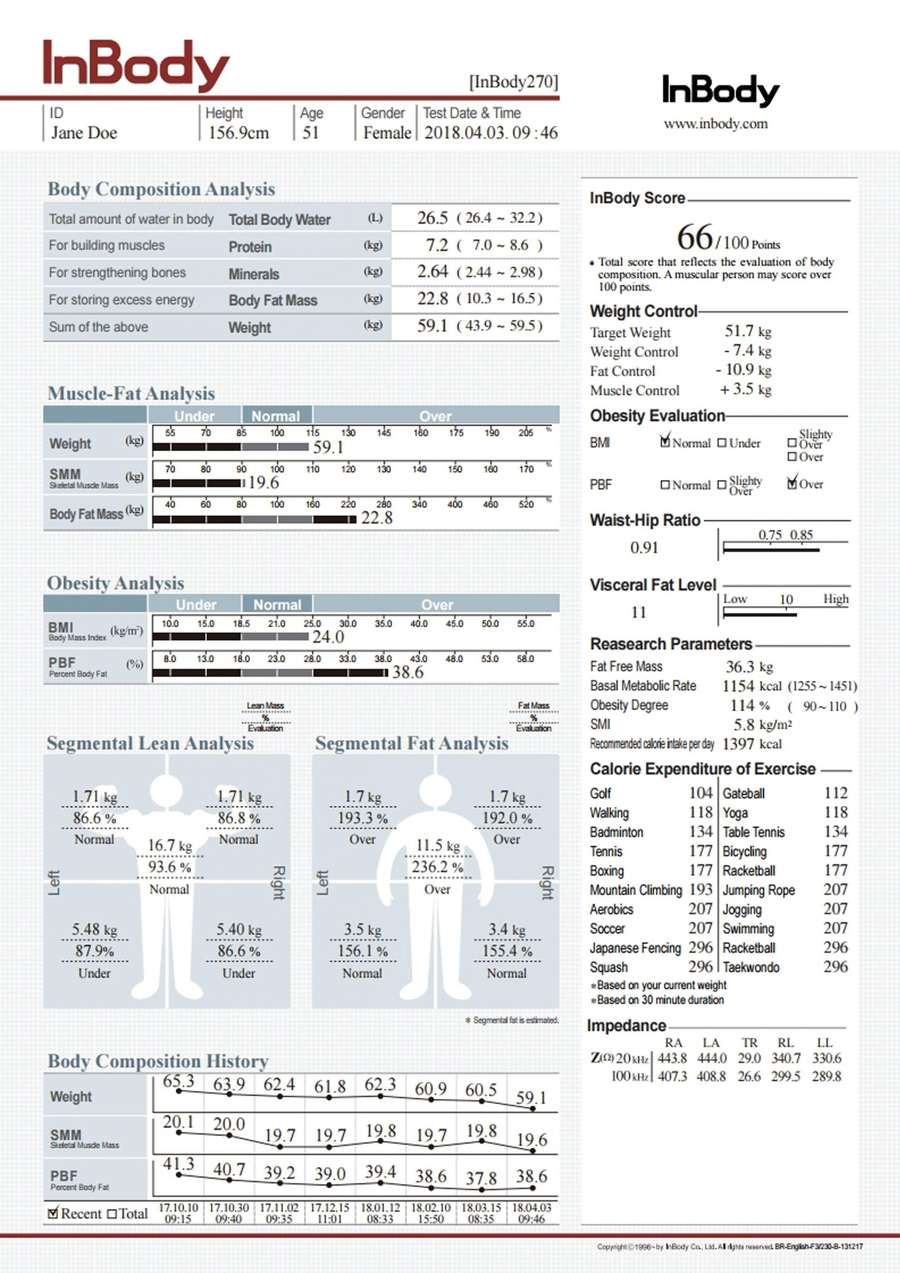
This guide covers why BMI falls short, how InBody’s BIA technology works, what every number on your results sheet means, who should test regularly, and what it costs in India.

What Is Body Composition Analysis?
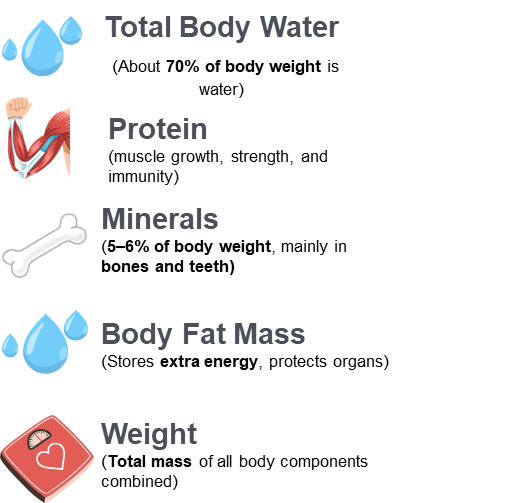
It separates your total body weight into its component parts: fat mass, skeletal muscle mass, bone mineral content, and water. Instead of “how much do you weigh?”, it asks the more useful question: what is your weight made of?
The most widely used method in India is the InBody scan, which uses bioelectrical impedance analysis (BIA) to map every major tissue component in under a minute.
The core difference: a scale measures gravity’s pull on your total mass. Body composition analysis measures the biological quality of that mass. One tells you how much you weigh; the other tells you whether you’re metabolically healthy.
Why BMI Fails to Measure Your Health
BMI was created in the 1830s by a Belgian mathematician studying population statistics, never designed to assess an individual’s health. It stuck because it needs nothing more than a scale and a measuring tape. The catch: a kilogram of fat and a kilogram of muscle weigh exactly the same — and BMI cannot tell them apart.
Consider two people, both 5’8″ and 75 kg, with an identical BMI of 25.0. Person A: 22% body fat, 30 kg muscle mass, visceral fat level 6 — healthy by every metabolic measure. Person B: 32% body fat, 22 kg muscle mass, visceral fat level 14 — a metabolic syndrome risk profile, despite the same “normal” BMI.
BMI cannot see this difference. Body composition analysis sees it instantly, for three reasons:
- It cannot separate fat from muscle. A trained athlete can be classified “overweight” simply because dense muscle raises the scale reading.
- It cannot locate fat. Visceral fat, wrapped around your organs, carries far greater health risk than fat under the skin — and BMI only sees total weight.
- It is inaccurate for Indian populations. Indians carry more body fat at lower BMI than Western populations; a BMI of 23, “normal” globally, may already be metabolically risky by Indian-specific thresholds.

The “skinny fat” problem in India: studies estimate 30–40% of normal-weight Indians are metabolically obese — high fat, low muscle, elevated visceral fat — invisible to BMI. It’s why hospitals, fitness centres, and corporate wellness programmes across India have largely moved past BMI as a primary screening metric.
How InBody’s BIA Technology Works
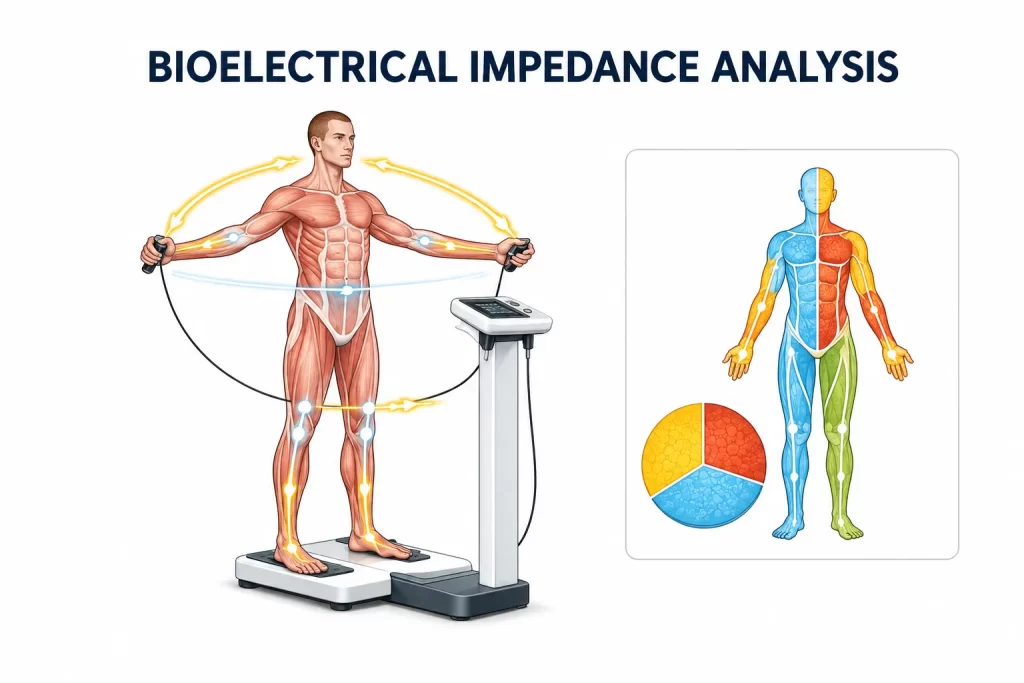
InBody uses Bioelectrical Impedance Analysis (BIA), the standard method for clinical assessment in outpatient settings, in under 60 seconds.
The science is straightforward: muscle holds a lot of water and conducts electricity easily; fat holds very little and resists it. InBody sends a safe, low-level current through your body — far too weak to feel — and calculates the exact mass of each tissue from how quickly the signal travels through it.
Where InBody differs from a bathroom scale is precision. Consumer scales use a single frequency through two electrode points (your feet) and estimate the rest. InBody uses Direct Segmental Multi-frequency BIA (DSM-BIA) with an eight-point tactile electrode system — each limb and the trunk measured separately — for roughly 98% correlation with DEXA, the hospital gold standard, in published studies.
Is BIA safe? Completely — the current is far below the threshold of perception, roughly 500 microamperes. It’s safe for adults, though not recommended for pacemaker wearers or others with implanted electronic devices, and pregnant women should avoid it as a precaution.
Every Parameter Explained: What Your Results Sheet Actually Measures
- Skeletal Muscle Mass (SMM): total metabolically active muscle, the primary driver of resting energy expenditure and glucose disposal.
- Body Fat Mass & Percentage: total fat weight and its share of body weight, including subcutaneous and visceral fat.
- Visceral Fat Level: rated 1–20. Fat around internal organs, strongly linked to insulin resistance, heart disease, and Type 2 diabetes.
- Phase Angle: a measure of cellular membrane integrity; low values indicate poor cellular function or chronic inflammation.
- Basal Metabolic Rate (BMR): resting calorie requirement calculated from fat-free mass, not total weight — essential for nutrition planning.
- Segmental Lean Analysis: muscle measured separately in each arm, leg, and the trunk, revealing imbalances invisible on an overall scan.
- Total Body Water & ECW/TBW Ratio: the split between water inside and outside your cells. An elevated ratio can signal inflammation or fluid imbalance.
- Fat-Free Mass (FFM): all non-fat tissue — muscle, bone, organs, and water — the metabolically active part of your body weight.
- InBody Score: a composite score from 0–100 summarising overall body composition, the easiest single number to track over time.
Healthy Reference Ranges: What the Numbers Mean
Body fat percentage for general adults
| Category | Men | Women | Clinical Significance |
|---|---|---|---|
| Very Low | <6% | <14% | Risk of hormonal disruption, bone loss |
| Healthy | 10–20% | 18–28% | Associated with optimal metabolic function |
| Borderline High | 21–25% | 29–35% | Increased metabolic risk; intervention advised |
| High | >25% | >35% | Significant cardiovascular and metabolic risk |
Visceral fat level on the InBody scale
| InBody Level | Status | Recommended Action |
|---|---|---|
| 1–9 | Normal range | Continue current lifestyle; monitor annually |
| 10–14 | Elevated | Dietary modification and exercise intervention advised |
| 15–20 | High risk | Urgent metabolic review; medical management required |
Indian-specific consideration: Asian populations are generally advised to use lower body fat and visceral fat thresholds than global averages. A visceral fat level of 9, acceptable by Western standards, may already warrant intervention in an Indian patient — always interpret results with a clinician familiar with population-specific risk.
Who Needs Body Composition Analysis?
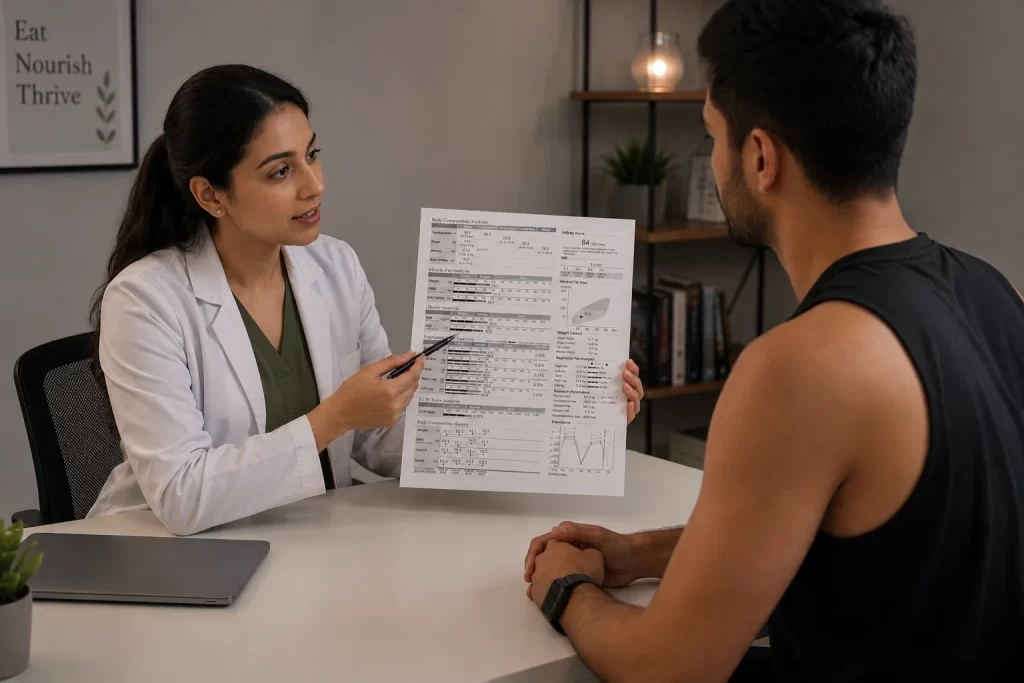
Nearly everyone — but a few groups get outsized value from testing regularly.
People losing weight
The scale lies. You can lose 4 kg of muscle and gain 4 kg of fat, and it reads “no change.” Body composition analysis shows what you actually lost, so you can fix the diet or training behind it.
People building muscle
Strength training adds muscle at roughly 0.2–0.5 kg per month — invisible on a scale, but unmissable on a segmental scan.
People over 40
Sarcopenia begins after 30 and accelerates after 50; by 70, the average sedentary adult has lost 30% of peak muscle mass. Body composition analysis catches this early, while it’s still reversible.
People with diabetes, PCOS, or metabolic syndrome
Visceral fat and ECW/TBW imbalance directly contribute to insulin resistance. Tracking these between visits gives endocrinologists data that BMI simply cannot provide.
Athletes
Segmental muscle balance, body water, and phase angle all come from the same scan. Sports academies and elite training centres use InBody for athlete profiling and injury-risk management.
Hospital patients
Bariatric surgery, oncology, dialysis, cardiac rehab, and recovery from major illness all benefit from routine tracking. Read more about InBody for hospitals and clinical use. Hospitals evaluating which analyser to install for these departments can compare specifications in our guide to choosing a body composition analyzer for hospitals.
Types of Body Composition Analysers: BIA vs DEXA vs BMI
| Method | How it works | Accuracy / clinical use | Time |
|---|---|---|---|
| BMI | Height-to-weight ratio | Can’t separate fat from muscle; screening flag at best | 1 sec |
| Home BIA scale | Single-frequency, feet only | Off by 5–10 points on body fat; swings between readings | 10 sec |
| InBody BIA scan | Multi-frequency, 8 tactile electrodes, each limb + trunk | ~98% correlation with DEXA; outpatient clinical standard | 60 sec |
| DEXA scan | Dual-energy X-ray absorptiometry | Hospital reference; adds bone density, uses radiation | ~20 min, ₹3,000–5,000 |
| Hydrostatic / air displacement | Water or air displacement | Accurate but impractical; rare in India, no segmental data | 15+ min |
For routine tracking, an InBody scan is the right choice for most people and clinics; DEXA is reserved for cases where bone density also needs assessing.
The Clinical Benefits of Body Composition Analysis
- Personalised health insights: two patients weighing 80 kg can need completely different interventions depending on their muscle-fat ratios, not generic weight-category advice.
- Objective progress tracking: regular scans reveal changes the scale can’t, such as simultaneous fat loss and muscle gain (recomposition), where weight stays flat for weeks while health improves.
- Early detection of metabolic risk: elevated visceral fat, declining muscle mass, and falling phase angle appear months or years before diabetes, cardiovascular disease, or sarcopenia.
- Precision nutritional guidance: BMR calculated from fat-free mass, not total weight, gives the accurate calorie and protein targets needed for effective nutrition planning.
- Sports performance optimisation: segmental lean analysis reveals muscle imbalances between limbs and changes through a training cycle, directly informing training design and injury-risk management.
Why Routine Tracking Beats a One-Time Snapshot
A single scan gives you a baseline — valuable, but limited. Only serial tracking at consistent intervals reveals whether an intervention is actually working.
The scale lie: a patient who gains 2 kg of muscle and loses 2 kg of fat shows zero change on a scale or in BMI — yet their metabolic risk profile has improved significantly, invisible without body composition tracking.
Routine tracking also catches risk earlier than blood work: a 2025 clinical review on BIA found that ECW/TBW ratio and visceral fat level predict cardiovascular risk ahead of standard blood biomarkers — especially relevant for the Indian “thin-fat” phenotype, where risk accumulates at BMI levels still called healthy.
A real case: 12 weeks of tracking that changed a diagnosis
A 36-year-old Mumbai marketing executive had cycled through three diets over two years, regaining the weight twice. Her BMI was 24.7 and her GP called her healthy, yet she felt exhausted. Her first InBody scan, taken through a corporate wellness programme, told a different story: visceral fat level 10 (high-risk), body fat 34.2% (obese by composition), and skeletal muscle 2.8 kg below norm. She had been losing fat and muscle together through calorie restriction alone, suppressing her metabolism and making each diet harder than the last.
After resistance training three times a week and raising protein intake to 1.3 g/kg/day, her 8-week follow-up scan showed:
| +1.9 kg Skeletal muscle gained |
−3.6% Body fat reduced |
−2 units Visceral fat level reduced |
+8 points InBody Score improvement |
Her scale weight had moved by less than 1 kg — without body composition data, she’d have concluded, again, that nothing was working. With it, she had objective proof, and stayed the course. By 12 weeks, her visceral fat had dropped to 8, below the risk threshold for the first time in years.
How to Get the Most Accurate Results
Body composition results can shift with hydration, food intake, and physical activity. Follow these guidelines before your scan for the most consistent results:
- Test in the morning, ideally fasted or at least 2–3 hours after your last meal
- Avoid vigorous exercise for at least 12 hours before the test, and alcohol or caffeine on the day
- Stay normally hydrated the day before — don’t deliberately dehydrate yourself
- Empty your bladder immediately before stepping on the device, and remove shoes, socks, and metal jewellery
- Hold the hand grips firmly and stand still for the full duration
- Test at the same time of day for every follow-up scan, so results stay comparable
- Tell the technician if you have a pacemaker or another implanted electronic device
Day-to-day variation is normal: numbers fluctuate slightly with hydration. What matters is the trend over time — monthly or quarterly scans against your own baseline, not any single reading.
How Much Does Body Composition Analysis Cost in India?
An InBody body composition test in India typically costs ₹500–₹2,000 per scan. Hospitals often bundle it into wellness or executive health packages; gyms and studios usually charge per scan; some corporate wellness programmes offer it free.
For B2B buyers — gyms, hospitals, and corporates looking to install their own machine — see our pages on InBody for gyms and InBody for hospitals.
Where to Get a Body Composition Test in India
InBody India operates over 1,500 verified test centres across 100+ cities. Browse our test centre locator, or check a city-specific guide:
- InBody scan centres in Mumbai
- InBody scan centres in Delhi NCR
- InBody scan centres in Bangalore
- InBody scan centres in Chennai
- InBody scan centres in Hyderabad
You stand on the device, hold the handles, and the result sheet prints automatically. To understand each section of the printout, read our complete guide to reading your InBody results sheet. Not sure which centre to pick? Our guide on how to choose a body composition test centre covers what separates a thorough test from a basic one.
Frequently Asked Questions
Why do doctors still use BMI if it’s considered inaccurate?
BMI was designed in the 1830s to study population trends, not diagnose individuals. It survives because it needs no equipment beyond a scale and tape measure. Clinics increasingly supplement it with BIA devices like InBody, which measure fat, muscle, and water directly.
Can I have a healthy BMI and still be at risk of heart disease?
Yes — this is called normal-weight obesity, or “skinny fat.” A “normal” BMI can hide high body fat and low muscle mass, raising cardiovascular risk to levels similar to clinical obesity. It’s common in Indian adults, and body composition analysis is the only way to catch it.
How does body composition analysis measure my fat and muscle without cutting me open?
It uses bioelectrical impedance analysis (BIA) — a safe current you cannot feel. Muscle conducts it differently to fat because it holds more water, so the device calculates each tissue’s mass from signal speed. InBody’s 8-point system measures each limb and the trunk separately, unlike a 2-point bathroom scale.
Will my body composition results change throughout the day?
Yes. Hydration, food, and recent exercise all shift the numbers slightly. For consistent tracking, test at the same time of day, ideally in the morning on an empty stomach.
How much does a body composition test cost in India?
An InBody test typically costs ₹500–₹2,000 per scan at gyms, hospitals, and wellness studios across India. Many hospitals bundle it into wellness packages, and some corporates offer it free to employees.
Is body composition analysis a serious medical tool, or just a gym gimmick?
It’s a validated clinical tool, not a novelty. InBody’s BIA shows roughly 98% correlation with DEXA in published studies, and is recommended in the Indian Consensus on Sarcopenia (2025) for assessing muscle mass. Hospitals, diabetes clinics, and sports medicine centres across India rely on it for this reason.
How often should I get a body composition test?
For general health tracking, every 8–12 weeks is enough time for real physiological change to appear. If you’re actively dieting or training, every 4–6 weeks allows earlier course correction. Patients managing diabetes, CKD, or sarcopenia are usually tracked quarterly.
Key Takeaways
- The BMI blind spot: BMI can’t distinguish muscle from fat, misclassifying muscular people as overweight and “skinny fat” people as healthy.
- Visceral fat is the real danger: it’s the strongest predictor of metabolic syndrome, heart disease, and Type 2 diabetes — and BMI can’t see it.
- Muscle is a health metric: your health is defined more by what you have (muscle mass) than what you weigh.
- Tracking beats a single snapshot: routine scans catch metabolic risk months before a blood test, and reveal fat-vs-muscle changes a scale can’t see.
- Hydration and cellular health matter: InBody tracks water balance and phase angle — markers a standard scale never touches.
- Actionable data over guesswork: it gives clinicians a biological map for precise decisions, not generic weight-loss goals.
Add Body Composition Analysis to Your Clinic
Join hundreds of diabetes, metabolic, and wellness clinics across India already using InBody to give patients objective, actionable health data beyond what any scale can provide.
Ready to get your first body composition scan?
Find an InBody Scanner Near You
Medical Disclaimer: This article is for informational and educational purposes only. It does not constitute medical advice, diagnosis, or treatment recommendations. Body composition results should always be interpreted in conjunction with a full clinical evaluation by a qualified healthcare provider. InBody devices are not intended to diagnose, treat, or cure any medical condition.
References & Further Reading
- Kalra S et al. Indian Consensus on Sarcopenia. Int J Gen Med. 2025;18:1731–1745.
- Potter AW et al. Real-world assessment of InBody 770 MFBIA vs DEXA in 1,000 adults. European Journal of Clinical Nutrition. 2025;79:1235–1244.
- Validation of InBody 770 against D2O and DEXA in 55 adult females. Sensors. 2025;25(16):5037.
- Benz E et al. Sarcopenic Obesity and Mortality Among Older People. JAMA Network Open. 2024;7(3):e243604.
- Son JW et al. Development and clinical application of BIA for body composition assessment. Obesity Reviews. 2025;26:e13844.
- McLester CN et al. Reliability and Agreement of Various InBody Analyzers vs DXA. Journal of Clinical Densitometry. 2020.
- InBody BWA. Diabetes Application — clinical use of InBody for T2DM screening.
