
Body Composition 15 min read
Body Fat Percentage Chart for Indians (Men, Women, Age)
If you are looking up “body fat percentage chart” in India, here is the problem: most charts you will find online use American or European thresholds. Indian bodies…
Reading about body composition? Find an InBody test centre near you →
If you are looking up “body fat percentage chart” in India, here is the problem: most charts you will find online use American or European thresholds. Indian bodies often do not fit those ranges. Studies of Asian populations, including Indians, find more body fat at the same BMI than in Caucasians[1][2] and South Asians living in Canada carried relatively more abdominal fat, especially visceral fat, than Europeans matched for BMI[3]. A WHO expert consultation also concluded that a substantial share of Asian people are already at high risk of type 2 diabetes and cardiovascular disease at BMIs below 25, the standard overweight cut-off[4].
This guide gives you body fat percentage ranges by gender, by age, and by goal, shows where Indian studies place the obesity cut-offs, and explains what your number really means for your health.
Why a separate body fat chart for Indians matters
Researchers describe a “thin-fat” phenotype in Indians, first reported in Indian newborns[5]. An Indian adult can look slim, have a normal BMI, and still carry more body fat (especially around the abdomen) than people of European descent. The evidence includes:
- Asian populations, including Indians in Singapore, have about 3–5 percentage points more body fat than Caucasians at the same BMI, and for the same body fat their BMI is 3–4 units lower[1][2].
- The WHO kept the international BMI cut-offs of 25 (overweight) and 30 (obese) for Asian populations, and added public-health action points at 23.0 and 27.5 kg/m²[4]. India’s own consensus guidelines define overweight as a BMI of 23–24.9 kg/m² and obesity as 25 kg/m² or more[6].
- In a DXA study of 2,347 Indian adults, body fat of 25% in men and 30% in women corresponded to a BMI of only about 22 kg/m², and body fat was higher than in Western populations at the same age and BMI[7]. In northern Indian patients with type 2 diabetes, obesity defined by body fat was above 25% in men and above 30% in women[8].
This is why body composition matters more than BMI for Indians. Two people can weigh the same and have the same BMI, but one may be healthy while the other carries excess body fat and more health risk.
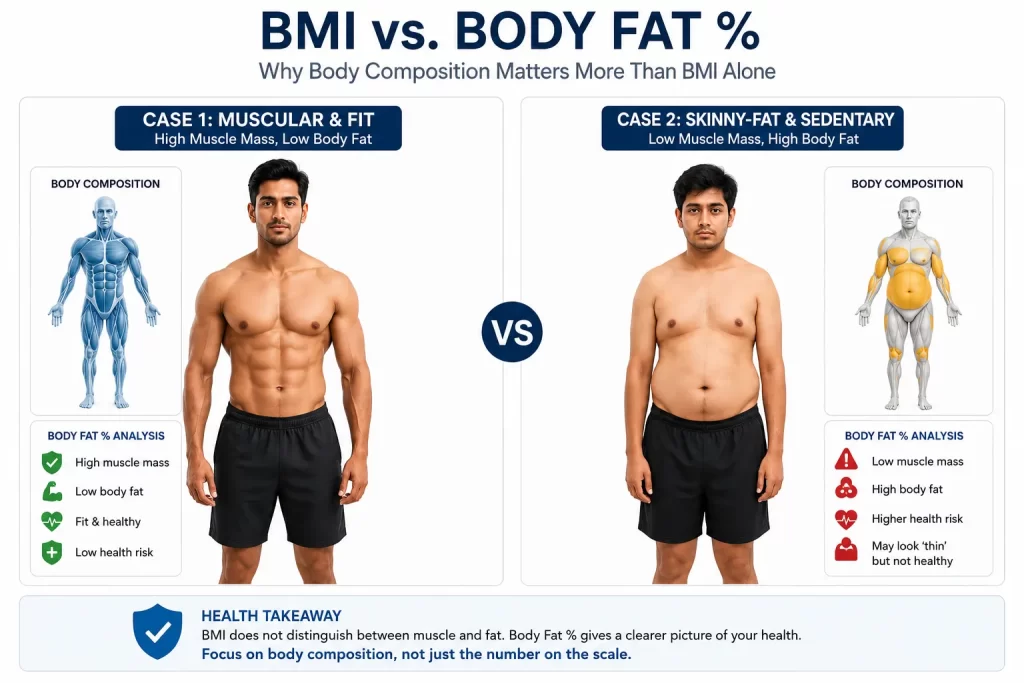
What Indian studies say about cut-offs. The charts below are general-population ranges adapted from ACE and Gallagher et al., not ranges derived from Indian measurements (see the note under each table). Indian studies and consensus papers place the obesity threshold lower:
- DXA in 2,347 healthy Indian adults: total body fat of 25% (men) and 30% (women) corresponded to a BMI of about 22 kg/m²[7].
- Northern Indian adults with type 2 diabetes (skinfold-derived body fat): obesity defined as above 25% (men) and above 30% (women)[8].
- The 2025 India Obesity Commission paper lists body-fat cut-offs for obesity of above 25.5% (men) and above 38% (women)[9].
These thresholds come from individual studies and expert consensus, and they differ by method and population, so treat a reading near the top of the healthy range as a prompt to check visceral fat, waist size and muscle mass too, not as a diagnosis.
Body fat percentage chart for men
| Category | Age 20–39 | Age 40–59 | Age 60–79 |
|---|---|---|---|
| Essential fat (minimum)[10] | 2–5% | 2–5% | 2–5% |
| Athletic / very fit | 6–13% | 6–13% | 6–13% |
| Healthy range (BMI 18.5–24.9 equivalent)[11] | 8–19% | 11–21% | 13–24% |
| Typical for non-athletes (ACE “average”) | 18–24% | 18–24% | 18–24% |
| Overweight (BMI 25–29.9 equivalent) | 20–24% | 22–27% | 25–29% |
| Obese (BMI 30+ equivalent; ACE: 25%+) | 25%+ | 28%+ | 30%+ |
Table note: adapted by InBody India from two general-population sources: the ACE body-fat categories (essential fat, athletic and “average”; not age-specific)[10] and Gallagher et al.’s BMI-based healthy, overweight and obese ranges by age[11]. These are not derived from Indian measurements: Gallagher’s sample was white, African-American and Japanese adults, and it uses the Western BMI limits of 25 and 30. The ranges overlap where the two sources define categories differently, and the Indian obesity cut-offs above are equal to or lower than the obesity row here.
For most men under 40, a sensible goal range is roughly 14–19% body fat, from the bottom of the ACE fitness range to the top of Gallagher’s healthy range[10][11]. That is where you typically have visible muscle definition and a lower risk of the conditions that become more common from midlife, such as hypertension, type 2 diabetes, and cardiovascular disease.
Body fat percentage chart for women
| Category | Age 20–39 | Age 40–59 | Age 60–79 |
|---|---|---|---|
| Essential fat (minimum) | 10–13% | 10–13% | 10–13% |
| Athletic / very fit | 14–20% | 14–20% | 14–20% |
| Healthy range (BMI 18.5–24.9 equivalent) | 21–32% | 23–33% | 24–35% |
| Typical for non-athletes (ACE “average”) | 25–31% | 25–31% | 25–31% |
| Overweight (BMI 25–29.9 equivalent) | 33–38% | 34–39% | 36–41% |
| Obese (BMI 30+ equivalent; ACE: 32%+) | 39%+ | 40%+ | 42%+ |
Table note: same sources and caveats as the men’s table. For women the obesity threshold varies most by source: 32% and above in ACE[10], 39% and above in Gallagher at ages 20–39[11], and roughly 30% to 38% in Indian studies and consensus[7][8][9].
Women naturally carry more body fat than men, partly because of reproductive and hormonal needs[10]. For most women, a sensible target is the ACE fitness range of 21–24% body fat, high enough for hormonal health and low enough to help manage the risk of PCOS, insulin resistance, and visceral fat-driven diseases.
Note: Women who sustain very low body fat or very low energy intake, especially while training hard, can lose their menstrual cycle[12]. Going very low is rarely worth the trade-off unless you are a competitive athlete with medical supervision.
What the chart cannot tell you (and the InBody scan can)
A percentage on its own is not enough. Two people with 22% body fat can have wildly different health profiles depending on:
- Visceral fat — the deep abdominal fat wrapped around your liver, pancreas, and intestines. This is the fat of most concern: abdominal adiposity in Asian Indians has been linked with early-onset disease[9]. A normal body fat % with high visceral fat can still be high-risk.
- Segmental muscle distribution — are you carrying muscle proportionally, or is your upper body weak and lower body bulky? A segmental scan shows where muscle is lacking.
- Skeletal muscle mass — total muscle reserve. In a large US survey, higher muscle mass relative to body size was associated with better insulin sensitivity[13].
- Body water balance (ECW/TBW) — reported by InBody, a high ratio can point to fluid imbalance, such as swelling, that body fat % alone does not show.
- Phase angle — often used as an indicator of cell health, which goes beyond fat percentage. More on phase angle here.
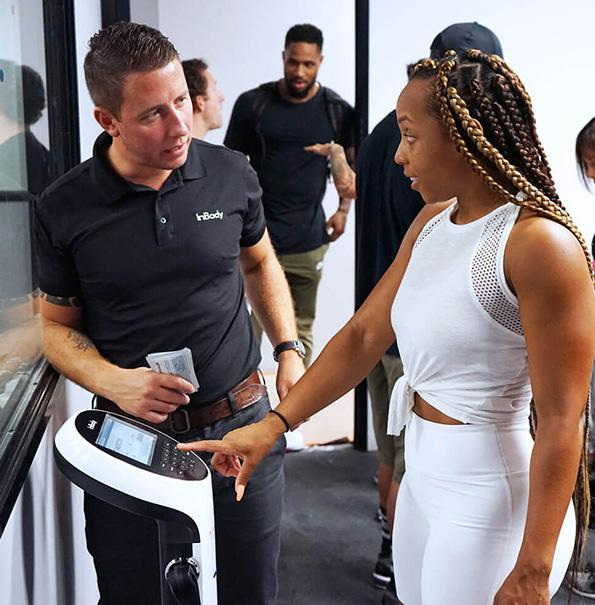
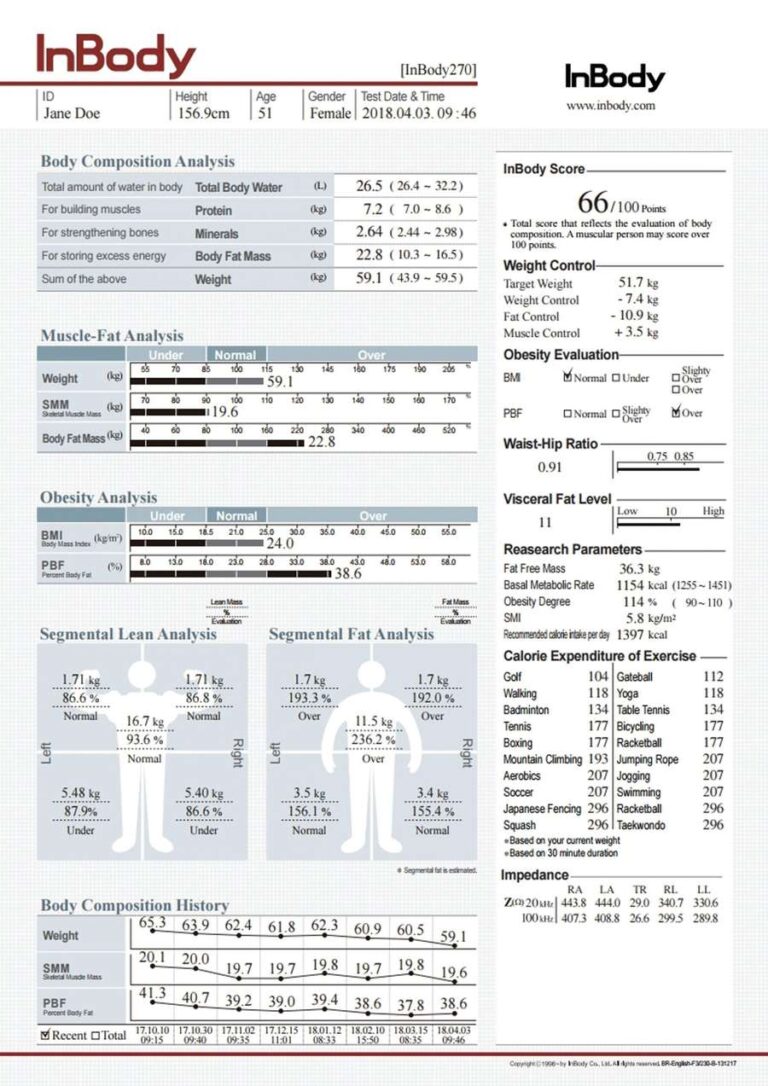
This is the difference between knowing your body fat percentage and actually understanding your body composition. A 60-second InBody scan gives you all of this in one printed sheet.
Body fat percentage by life stage: 20s through 60+
The charts above give you ranges by broad age band. Published age-banded ranges such as Gallagher’s come in 20-year bands[11], so the ranges below repeat across your 20s and 30s and across your 40s and 50s; what changes by decade is the priority. Hormonal changes, muscle loss, and life-stage demands (pregnancy, menopause) all shift what matters at each phase. Here is the more detailed breakdown.
Your 20s: the foundation decade
| Range | Men 20s | Women 20s |
|---|---|---|
| Athletic / fit (ACE athletes to fitness) | 6–17% | 14–24% |
| Healthy range (BMI 18.5–24.9 equivalent) | 8–19% | 21–32% |
| Typical for non-athletes (ACE “average”) | 18–24% | 25–31% |
| Overweight (BMI 25–29.9 equivalent) | 20–24% | 33–38% |
| Obese (BMI 30+ equivalent) | 25%+ | 39%+ |
Priority: build skeletal muscle aggressively — strength training 3–5x/week, protein at 1.6–2.2 g/kg/day if you are lifting[14]. This is the decade where the skinny-fat pattern can entrench if neglected.
Your 30s: the trade-off decade
| Range | Men 30s | Women 30s |
|---|---|---|
| Athletic / fit (ACE athletes to fitness) | 6–17% | 14–24% |
| Healthy range (BMI 18.5–24.9 equivalent) | 8–19% | 21–32% |
| Typical for non-athletes (ACE “average”) | 18–24% | 25–31% |
| Overweight (BMI 25–29.9 equivalent) | 20–24% | 33–38% |
| Obese (BMI 30+ equivalent) | 25%+ | 39%+ |
Priority: defend your muscle. Resistance training 3–4x/week is a strong priority — calorie deficits without enough protein can cost you muscle.
Your 40s: the inflection decade
| Range | Men 40s | Women 40s |
|---|---|---|
| Athletic / fit (ACE athletes to fitness) | 6–17% | 14–24% |
| Healthy range (BMI 18.5–24.9 equivalent) | 11–21% | 23–33% |
| Typical for non-athletes (ACE “average”) | 18–24% | 25–31% |
| Overweight (BMI 25–29.9 equivalent) | 22–27% | 34–39% |
| Obese (BMI 30+ equivalent) | 28%+ | 40%+ |
Priority: aggressive muscle preservation. In women, the menopause transition is linked with faster fat gain and lean-mass loss[15]. In India, metabolic syndrome prevalence climbs with age: a pooled analysis of Indian studies found about 30% of adults affected, rising from 13% at ages 18–29 to 50% at ages 50–59[16]. Visceral fat tracking matters alongside the body fat percentage.
Your 50s: the prevention decade
| Range | Men 50s | Women 50s |
|---|---|---|
| Athletic / fit (ACE athletes to fitness) | 6–17% | 14–24% |
| Healthy range (BMI 18.5–24.9 equivalent) | 11–21% | 23–33% |
| Typical for non-athletes (ACE “average”) | 18–24% | 25–31% |
| Overweight (BMI 25–29.9 equivalent) | 22–27% | 34–39% |
| Obese (BMI 30+ equivalent) | 28%+ | 40%+ |
Priority: body composition becomes a disease-risk lever, not a vanity metric — visceral fat management and muscle preservation deserve as much attention as weight loss alone.
Your 60s and beyond: the function decade
| Range | Men 60+ | Women 60+ |
|---|---|---|
| Healthy range (BMI 18.5–24.9 equivalent) | 13–24% | 24–35% |
| Typical for non-athletes (ACE “average”) | 18–24% | 25–31% |
| Overweight (BMI 25–29.9 equivalent) | 25–29% | 36–41% |
| Obese (BMI 30+ equivalent) + sarcopenia concern[17] | 30%+ OR low muscle mass at any body fat % | 42%+ OR low muscle mass at any body fat % |
Priority: body fat percentage matters less here than functional muscle mass. A 65-year-old at 28% body fat with strong legs and good grip strength can be in better shape than a 65-year-old at 22% who is sarcopenic and frail. Strength training is one of the best-supported interventions at this age: a Cochrane review of 121 trials found that progressive resistance training improved muscle strength and physical function in older adults[18].
Pregnancy and post-partum: these charts are not designed for use during pregnancy. Post-partum, body composition changes gradually — and “return” should mean the same skeletal muscle mass and a healthy visceral fat level, not necessarily the same scale weight.
How to lower your body fat percentage (the realistic path)
If you are above the healthy range, a commonly cited pace is about 1 percentage point of body fat per month. ACE notes that no official guideline exists, but most experts consider this generally safe and achievable[10]. A slower rate of weight loss can also protect or build lean mass when combined with strength training: in a trial of 24 athletes, losing 0.7% of body weight per week increased lean mass by about 2%, while 1.4% per week left it unchanged[19].
The essentials:
- Protein at 1.6–2.2 g per kg bodyweight per day if you are resistance training. In trials, muscle gains from resistance training levelled off at about 1.6 g/kg/day, and the authors suggested up to ~2.2 g/kg/day to maximise gains[14]. For healthy adults in general, the ICMR-NIN 2020 RDA is 0.83 g/kg/day, or 1 g/kg/day for people on cereal-based diets with low-quality protein[20]. Indian diets get almost 60% of their protein from cereals, which have lower digestibility and quality[21], so check this first.
- Resistance training 3–4×/week. Not just cardio: diet-induced weight loss reduces muscle mass, and while aerobic and resistance exercise both help preserve it, resistance exercise also improves muscle strength[22]. WHO recommends regular muscle-strengthening activity for all adults[23]. See the full muscle-building protocol here.
- Calorie deficit of 300–500 kcal/day. Aggressive cuts (over 1,000 kcal deficit) are harder to sustain, and adequate protein helps preserve muscle during weight loss[22].
- Sleep 7+ hours. Across studies, short sleepers have a higher risk of obesity, although cause and effect is hard to prove[24].
- Track body composition, not just weight. The scale can mislead. If you lose 4 kg of weight but 2 kg of it was muscle, you may have made yourself less healthy. A body composition scan such as an InBody scan can show the difference. Wondering if the extra step is worth it? See our honest breakdown of whether a body composition test is worth it.
Frequently asked questions
Q. What is a healthy body fat percentage for an Indian man at 30?
Roughly 14–19% sits between the ACE fitness range and the top of the healthy range for men aged 20–39[10][11]. Below 14% is the athletic range[10]. Indian studies place the obesity threshold at above about 25% body fat in men[7][8], so a reading in the low-to-mid 20s is worth checking against waist size and visceral fat.
Q. Is 25% body fat acceptable for an Indian woman in her 30s?
Q. Why are Indian body fat thresholds different from Western charts?
Indians often show a “thin-fat” pattern — higher body fat and more abdominal fat at the same BMI compared to people of European descent[1][3]. Differences in body build and muscularity are thought to contribute[1]. India’s consensus BMI cut-offs start at 23 kg/m² for overweight and 25 kg/m² for obesity[6] (versus 25 and 30 internationally; the WHO kept 25 and 30 but added action points at 23 and 27.5[4]).
Q. Can I measure body fat percentage at home?
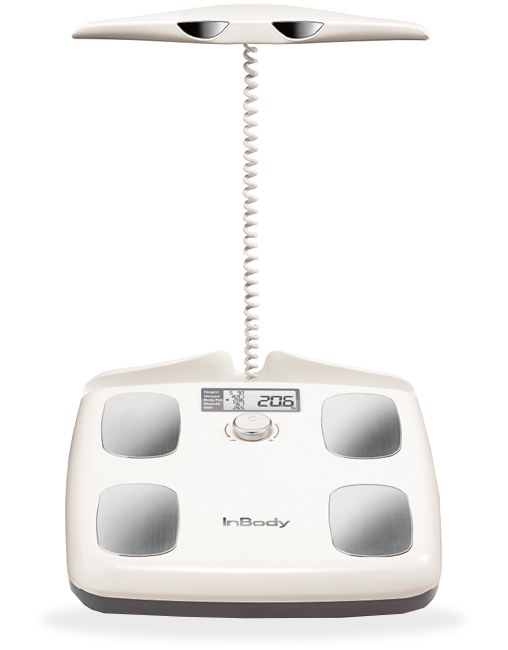
Yes, with a smart body composition scale like the InBody Dial H40 or H30, which use bioelectrical impedance (BIA), the same type of technology as professional InBody machines (just at a consumer price point). Skinfold callipers depend heavily on the operator and can be less reliable at higher body fat. Bathroom scales that “estimate” body fat vary widely in accuracy, so every method has measurement error: look at trends over weeks to months rather than single readings[10].
Q. How accurate is the InBody scan vs DEXA for body fat percentage?
Published studies comparing InBody analysers with DEXA report close agreement with a small systematic bias: in 67 healthy adults, the InBody 230, 720 and 770 slightly underestimated body fat percentage compared with DXA[25], and in a study of 50 adults the InBody 520 and 720 were valid estimators of fat mass and lean mass[26]. Treat a single reading as an estimate. The InBody is faster (60 seconds vs 10–20 minutes), uses no ionising radiation, and costs a fraction per scan. Full InBody vs DEXA comparison here.
Q. Does body fat percentage need to rise with age?
Modestly, yes. Reference ranges rise with age: Gallagher’s healthy range tops out 3–5 percentage points higher at ages 60–79 than at 20–39 (men 19% to 24%, women 32% to 35%)[11]. The aggressive “stay at 12% body fat at 55” goal is rarely realistic and can cost muscle, sleep quality, and hormonal health. A rise much beyond that range is worth a closer look at activity, diet and muscle mass.
Q. My InBody scan says I’m overweight but I look fine in the mirror. What gives?
This is the classic skinny-fat pattern: a normal-looking BMI with high body fat and low muscle. In Indian data, 25% body fat in men and 30% in women corresponded to a BMI of only about 22[7], so it is not unusual at BMI 22–24, particularly without resistance training. The mirror sees “thin.” The scan sees high body fat, low muscle, often high visceral fat. The scan is right — the mirror is using clothing as a confounder.
Stop guessing your body fat percentage. An InBody scan gives you body fat, muscle mass, visceral fat, segmental balance, and phase angle — all in 60 seconds. Find an InBody test centre near you or compare InBody home scales to track your numbers weekly.
References
- Deurenberg P, Deurenberg-Yap M, Guricci S. Asians are different from Caucasians and from each other in their body mass index/body fat per cent relationship. Obes Rev. 2002;3(3):141-146. PubMed · DOI
- Deurenberg-Yap M, Schmidt G, van Staveren WA, Deurenberg P. The paradox of low body mass index and high body fat percentage among Chinese, Malays and Indians in Singapore. Int J Obes Relat Metab Disord. 2000;24(8):1011-1017. PubMed · DOI
- Lear SA, Humphries KH, Kohli S, Chockalingam A, Frohlich JJ, Birmingham CL. Visceral adipose tissue accumulation differs according to ethnic background: results of the Multicultural Community Health Assessment Trial (M-CHAT). Am J Clin Nutr. 2007;86(2):353-359. PubMed · DOI
- WHO Expert Consultation. Appropriate body-mass index for Asian populations and its implications for policy and intervention strategies. Lancet. 2004;363(9403):157-163. PubMed · DOI
- Yajnik CS, Fall CH, Coyaji KJ, Hirve SS, Rao S, Barker DJ, Joglekar C, Kellingray S. Neonatal anthropometry: the thin-fat Indian baby. The Pune Maternal Nutrition Study. Int J Obes Relat Metab Disord. 2003;27(2):173-180. PubMed · DOI
- Misra A, Chowbey P, Makkar BM, Vikram NK, Wasir JS, Chadha D, et al. Consensus statement for diagnosis of obesity, abdominal obesity and the metabolic syndrome for Asian Indians and recommendations for physical activity, medical and surgical management. J Assoc Physicians India. 2009;57:163-170. PubMed
- Marwaha RK, Tandon N, Garg MK, Narang A, Mehan N, Bhadra K. Normative data of body fat mass and its distribution as assessed by DXA in Indian adult population. J Clin Densitom. 2014;17(1):136-142. PubMed · DOI
- Vikram NK, Misra A, Pandey RM, Dudeja V, Sinha S, Ramadevi J, Kumar A, Chaudhary D. Anthropometry and body composition in northern Asian Indian patients with type 2 diabetes: receiver operating characteristics (ROC) curve analysis of body mass index with percentage body fat as standard. Diabetes Nutr Metab. 2003;16(1):32-40. PubMed
- Misra A, Vikram NK, Ghosh A, Ranjan P, Gulati S; India Obesity Commission Members. Revised definition of obesity in Asian Indians living in India. Diabetes Metab Syndr. 2025;19(1):102989. PubMed · DOI
- Muth ND. What are the guidelines for percentage of body fat loss? ACE Fitness blog, American Council on Exercise, 2 December 2009 (professional-body web page, not peer-reviewed; includes ACE Table 6.14, General Body-fat Percentage Categories). Archived copy: web.archive.org
- Gallagher D, Heymsfield SB, Heo M, Jebb SA, Murgatroyd PR, Sakamoto Y. Healthy percentage body fat ranges: an approach for developing guidelines based on body mass index. Am J Clin Nutr. 2000;72(3):694-701. PubMed · DOI
- De Souza MJ, Nattiv A, Joy E, Misra M, Williams NI, Mallinson RJ, et al. 2014 Female Athlete Triad Coalition Consensus Statement on Treatment and Return to Play of the Female Athlete Triad. Br J Sports Med. 2014;48(4):289. PubMed · DOI
- Srikanthan P, Karlamangla AS. Relative muscle mass is inversely associated with insulin resistance and prediabetes. Findings from the third National Health and Nutrition Examination Survey. J Clin Endocrinol Metab. 2011;96(9):2898-2903. PubMed · DOI
- Morton RW, Murphy KT, McKellar SR, Schoenfeld BJ, Henselmans M, Helms E, et al. A systematic review, meta-analysis and meta-regression of the effect of protein supplementation on resistance training-induced gains in muscle mass and strength in healthy adults. Br J Sports Med. 2018;52(6):376-384. PubMed · DOI
- Greendale GA, Sternfeld B, Huang M, Han W, Karvonen-Gutierrez C, Ruppert K, et al. Changes in body composition and weight during the menopause transition. JCI Insight. 2019;4(5):e124865. PubMed · DOI
- Krishnamoorthy Y, Rajaa S, Murali S, Rehman T, Sahoo J, Kar SS. Prevalence of metabolic syndrome among adult population in India: A systematic review and meta-analysis. PLoS One. 2020;15(10):e0240971. PubMed · DOI
- Cruz-Jentoft AJ, Bahat G, Bauer J, Boirie Y, Bruyère O, Cederholm T, et al. Sarcopenia: revised European consensus on definition and diagnosis. Age Ageing. 2019;48(1):16-31. PubMed · DOI
- Liu CJ, Latham NK. Progressive resistance strength training for improving physical function in older adults. Cochrane Database Syst Rev. 2009;(3):CD002759. PubMed · DOI
- Garthe I, Raastad T, Refsnes PE, Koivisto A, Sundgot-Borgen J. Effect of two different weight-loss rates on body composition and strength and power-related performance in elite athletes. Int J Sport Nutr Exerc Metab. 2011;21(2):97-104. PubMed · DOI
- ICMR-National Institute of Nutrition. A Brief Note on Nutrient Requirements for Indians, the Recommended Dietary Allowances (RDA) and the Estimated Average Requirements (EAR), 2020. nin.res.in (PDF)
- Swaminathan S, Vaz M, Kurpad AV. Protein intakes in India. Br J Nutr. 2012;108(Suppl 2):S50-S58. PubMed · DOI
- Cava E, Yeat NC, Mittendorfer B. Preserving healthy muscle during weight loss. Adv Nutr. 2017;8(3):511-519. PubMed · DOI
- Bull FC, Al-Ansari SS, Biddle S, Borodulin K, Buman MP, Cardon G, et al. World Health Organization 2020 guidelines on physical activity and sedentary behaviour. Br J Sports Med. 2020;54(24):1451-1462. PubMed · DOI
- Cappuccio FP, Taggart FM, Kandala NB, Currie A, Peile E, Stranges S, Miller MA. Meta-analysis of short sleep duration and obesity in children and adults. Sleep. 2008;31(5):619-626. PubMed · DOI
- McLester CN, Nickerson BS, Kliszczewicz BM, McLester JR. Reliability and agreement of various InBody body composition analyzers as compared to dual-energy X-ray absorptiometry in healthy men and women. J Clin Densitom. 2020;23(3):443-450. PubMed · DOI
- Anderson LJ, Erceg DN, Schroeder ET. Utility of multifrequency bioelectrical impedance compared with dual-energy x-ray absorptiometry for assessment of total and regional body composition varies between men and women. Nutr Res. 2012;32(7):479-485. PubMed · DOI

Most trending articles
वज़न बढ़ाने के लिए क्या खाएं? सही डाइट प्लान (सिर्फ ज़्यादा खाना नहीं)
सिर्फ ज़्यादा खाने से मांसपेशी नहीं बनती, चर्बी बढ़ सकती है। सही कैलोरी सरप्लस, प्रोटीन और डाइट प्लान जो वज़न को सही तरीके से बढ़ाए — पूरी जानकारी हिंदी में।
भारत में प्रोटीन कितना ज़रूरी है? असली आंकड़े और सही फॉर्मूला
IMRB के एक सर्वे में लगभग 73% भारतीय आहार प्रोटीन-कम पाए गए। सही प्रोटीन टारगेट कैसे निकालें और किन फूड्स से पूरा करें — पूरी जानकारी हिंदी में।
Metabolic Age क्या होती है? आपकी उम्र से ज़्यादा है या कम?
आपकी असली उम्र 34 है पर शरीर 50 साल जैसा व्यवहार कर सकता है। Metabolic age क्या है, मांसपेशी घटने के जोखिम क्या हैं और इसे कैसे घटाएं — पूरी जानकारी।