
Body Composition 7 min read
Body Composition Scans in a Dietitian’s Practice (India)
How Indian dietitians use a body composition report to personalise plans, track muscle and fat, and show progress when the scale stalls.
Reading about body composition? Find an InBody test centre near you →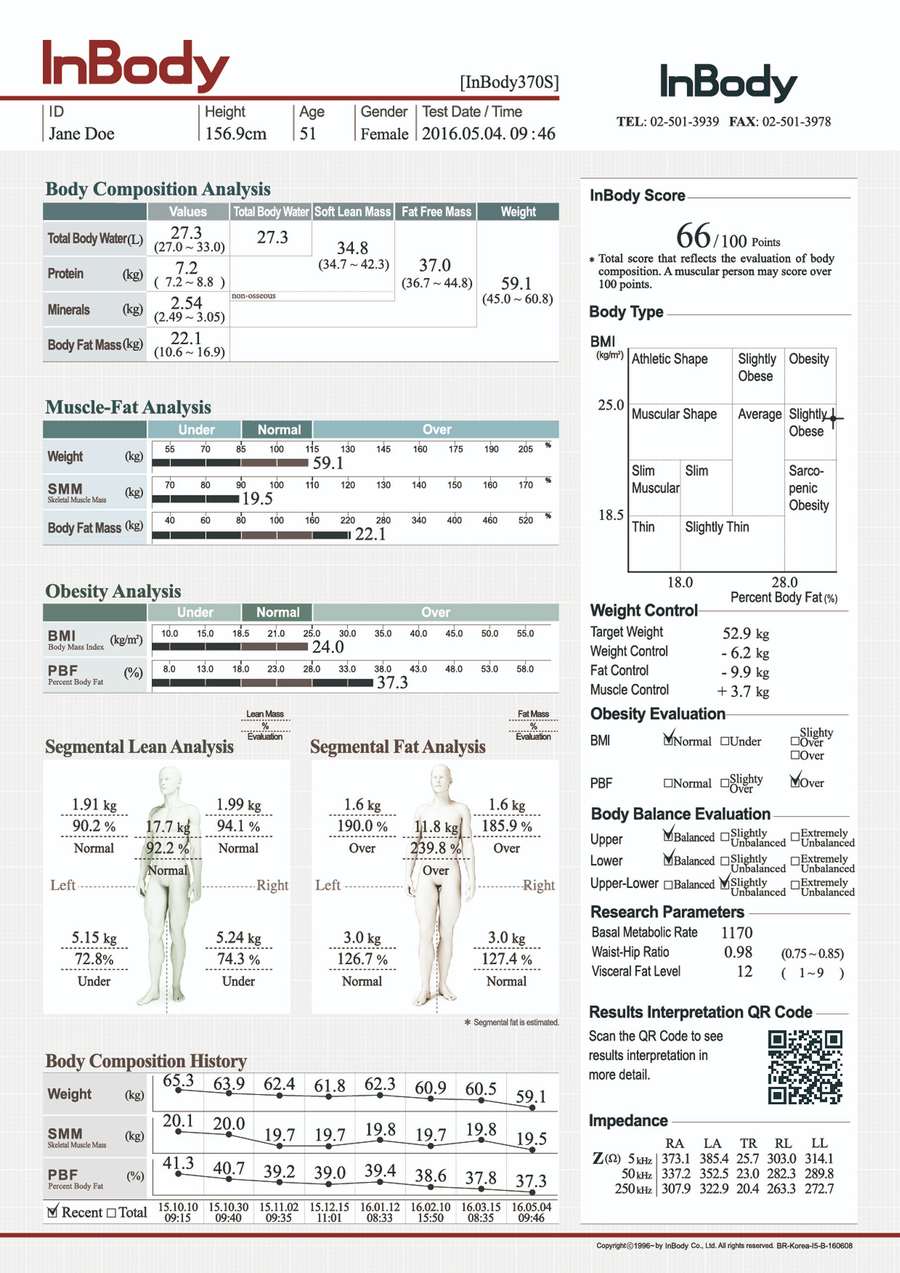
Body Composition Scans in a Dietitian’s Practice (India)
A client has followed your plan for six weeks. The scale has not moved. They are frustrated, you suspect they have gained muscle and lost fat, and you have no way to show it. This is the situation where body composition analysis for dietitians earns its place in a practice: it gives you a second progress marker when scale weight stalls, and a better starting picture than weight and BMI.
This guide is written for practising dietitians and nutritionists in India, not for clients. It covers what a result sheet gives you in a consult, how to set a baseline, how to personalise protein and calorie targets, what to do when the scale stalls, special cases (GLP-1, bariatric, postpartum, PCOS), and where bioimpedance has real limits. We have been careful not to claim more than the evidence supports. For example, there is no good evidence that scans reduce client dropout, and we do not suggest they do.
What You Can Read From the Report
Outputs vary by model, so check the list for the exact device. The numbers dietitians use most:
| Output | Why it matters in a consult |
|---|---|
| Skeletal muscle mass | Shows whether weight loss is costing muscle, and sets a target for protein and strength work |
| Percent body fat and fat mass | Tracks fat change separately from weight |
| Visceral fat (level or area, depending on the model) | Flags abdominal fat that BMI hides |
| Basal metabolic rate (BMR) | A starting point for calorie targets, to be cross-checked clinically |
| Total body water, and ECW/TBW on higher models | Helps separate fluid changes from tissue changes |
| Segmental lean and fat | Shows where muscle and fat sit, and imbalance |
Not every model reports every row. For example, the InBody 270S lists visceral fat level but not ECW/TBW or phase angle, while the 570, 770S and 970S add ECW/TBW. Match the output list to what you want to chart before you choose a model. Our guide to reading the InBody report explains each section in detail, and the result sheet page shows what a printout looks like.
Setting the Baseline: Weight for Height, Muscle for Height
Weight and BMI describe how much someone weighs. A scan describes what the weight is made of. Two clients at 65 kg and BMI 24 can have very different fat and muscle, and in India, where the thin-fat phenotype is common, this matters. Record at baseline: muscle mass, body fat percentage, visceral fat, and the date and device. These become the reference you compare against. Insist on consistent conditions for repeat scans: same time of day, similar hydration, no heavy exercise beforehand. Our test preparation guide can be shared with clients.
Personalising Protein and Calorie Targets
Use the report to inform, not dictate. A client with low muscle mass relative to height is a stronger candidate for a higher protein target and resistance training than one whose muscle is adequate. For active weight reduction, a 2025 joint advisory on nutrition during weight loss reports that higher protein intakes of about 1.2 to 1.6 g per kg per day have been proposed, with caution for people with kidney disease. Treat it as a reference, not a rule for every client. Our post on protein requirements for Indians covers vegetarian sources and practical targets.
BMR from a scan is an estimate. Use it as one input alongside your usual clinical assessment and the client’s actual response, not as an exact calorie prescription.
When the Scale Stalls: Recomposition or a Real Plateau?
Three weeks without a change in weight is a common reason clients drop out. A scan can separate two very different situations:
- Recomposition. Weight is flat but fat mass is falling and muscle is holding or rising. The plan is working; the scale is misleading.
- A true plateau. Fat mass and muscle are both flat. Time to review intake, activity, sleep and adherence.
- Muscle loss. Weight is falling but a growing share is lean mass. Review protein and training before pushing the deficit further.
Be honest with clients about what this does for adherence. We looked for evidence that giving clients body composition feedback reduces dropout and did not find it. What a scan reliably gives you is a way to show progress the scale hides. That is useful, but it is a communication tool, not a retention guarantee.
Special Cases Worth Planning For
- Clients on GLP-1 medicines. Weight loss includes lean mass; coordinate with the prescriber and see GLP-1 and muscle loss.
- After bariatric surgery. See body composition tracking after bariatric surgery.
- Postpartum clients. See postpartum body recomposition.
- PCOS. See PCOS and body composition in Indian women.
- Malnutrition screening. Reduced muscle mass is an independent criterion in the GLIM framework; see our explainer on GLIM criteria.
Re-Scan Rhythm and Test Conditions
There is no guideline interval for dietetic practice. Pick a rhythm that fits the plan, for example at baseline and then every few weeks to a few months depending on the goal, document it as clinic practice, and keep the device and conditions identical. Changes smaller than the device’s known error, especially segmental values, should be reported as “no meaningful change” and not as progress.
What Bioimpedance Cannot Tell You
- Hydration extremes. The ESPEN guideline on bioimpedance describes it as valid in healthy people and in patients with stable hydration, and advises caution at extremes of BMI and abnormal hydration. Oedema, dehydration, ascites and dialysis need a different approach.
- Children. Validation work in Indian school-age children found that bioimpedance under-estimated body fat compared with DXA, so be cautious using adult equations for kids.
- Absolute values. Independent comparisons with DXA show systematic differences, so use the same device for trends. Single-frequency devices may be less precise for tracking individual change than multi-frequency, segmental ones. Our post on DSM-BIA versus single-frequency BIA explains why.
Presenting Results to Clients
Keep it simple. Show two or three numbers, not thirty: muscle, fat, and one that matches the client’s goal. Use the printout as a visual, explain what moved and what did not, and agree one action for the next interval. For clients who want a structured self-driven plan, our 90-day playbook is a useful handout.
Single-Frequency or Multi-Frequency for a Clinic
If you mostly track body fat and muscle in healthy clients, a simpler model may be sufficient. If you see patients with fluid issues, older clients or complex conditions, models with multi-frequency measurement, segmental analysis and ECW/TBW give you more to work with. Compare options in our analyser buying guide.
Frequently Asked Questions
Does a body composition test help weight-loss clients stay on plan?
There is no good evidence that it reduces dropout. What it does is show progress that the scale hides, such as fat falling while muscle holds. Use it as a communication tool alongside regular follow-up, not as a promise of better adherence.
Which numbers should I track monthly?
Skeletal muscle mass, percent body fat and visceral fat are the core three for most clients. Add ECW/TBW if your model reports it and the client has fluid concerns, and segmental values if imbalance matters for their goal.
Can bioimpedance replace skinfold measurements?
For many practices it is quicker and less dependent on operator technique, but the two methods give different absolute values. Pick one method and use it consistently for each client rather than mixing them in the same record.
Is it suitable for vegetarian Indian clients?
Yes. The scan measures body tissue, not diet. Vegetarian clients may need extra attention to protein sources, which is a dietary question you address after reading muscle mass, not a limit of the test.
Can I use it for children?
Be cautious. Validation work in Indian school-age children found bioimpedance under-read body fat versus DXA, and adult equations may not apply. For children, rely on growth charts and paediatric guidance, and treat scan values as approximate.
What if the client’s hydration varies a lot between visits?
Standardise conditions as far as you can and note any differences. If hydration swings widely, interpret fat and muscle changes cautiously and consider repeating the scan once conditions are comparable.
See How a Scan Fits Your Practice
If you run a dietetic or nutrition clinic and want to see a result sheet in action, explore the InBody analyser range or request a demo and quote.
This article is for healthcare professionals and general education. It does not replace clinical assessment.

Most trending articles
Student Fitness Screening in India: A Guide for Schools
CBSE HPE, Fit India and Khelo India rely on BMI. How schools and colleges can add body composition screening safely, with child caveats and DPDP consent.
Creatine and Your Body Composition Scan: What Changes
Creatine raises body water and lean mass readings within a week on BIA and DXA. What the studies show and how to time your scans to read progress honestly.
Fitness Testing and Body Composition for Sports Academies
A practical fitness testing battery for Indian sports academies: body composition, grip, jumps, sprints, Yo-Yo, Khelo India context and youth maturation.