
Body Composition 10 min read
Stages of Obesity in India: Why 43% of “Normal-Weight” People Are Already In One [2026 Guide]
43% of 'normal-weight' Indians are metabolically obese, ICMR data shows. Here are WHO's 4 stages of obesity — and why India's BMI cutoffs are lower.
Reading about body composition? Find an InBody test centre near you →![Stages of Obesity in India: Why 43% of “Normal-Weight” People Are Already In One [2026 Guide]](https://www.inbody.in/blog/wp-content/uploads/2026/08/inbody-270-body-composition-analyzer.jpg)
Stages of Obesity in India: Why 43% of “Normal-Weight” People Are Already In One [2026 Guide]
Your BMI says 23.4. Your doctor calls that normal. Meanwhile your waist has grown two inches since last year, your fasting sugar is creeping toward the upper limit, and you’re more tired at 3pm than you used to be after a full day of travel. Somewhere between the chart and your actual body, something isn’t adding up.
That gap is not in your head. The stages of obesity — the WHO’s official ladder from overweight through Class 1, Class 2, and Class 3 obesity — were built on a scale that was never calibrated for how Indians actually carry fat. And according to India’s own national diabetes research body, a large share of people who are technically “normal weight” on that scale are already living with the metabolic consequences of obesity. Understanding what each stage really means, where India’s own cutoffs diverge from the global standard, and why the number on your BMI chart can miss the problem entirely is the first step to knowing what your body is actually telling you.
What Are the Stages of Obesity? The WHO Classification Explained
Obesity is not a single condition — it is a graded spectrum, and the World Health Organization’s Body Mass Index (BMI) system is still the most widely used way to stage it. BMI is calculated as weight in kilograms divided by height in metres squared. It’s crude, it says nothing about muscle versus fat, but it remains the entry point every clinician in India starts from, so it’s worth knowing exactly where the lines are drawn.
| Stage | BMI (kg/m²) | What it generally signals |
|---|---|---|
| Underweight | Below 18.5 | Insufficient body mass; nutritional risk |
| Normal / healthy weight | 18.5–24.9 | Global reference range for lowest average health risk |
| Overweight | 25.0–29.9 | Early excess adiposity; risk begins rising |
| Obesity Class 1 | 30.0–34.9 | Moderate obesity; meaningfully elevated disease risk |
| Obesity Class 2 | 35.0–39.9 | Severe obesity; high risk of diabetes, hypertension, joint disease |
| Obesity Class 3 | 40.0 and above | Very severe (historically called “morbid”) obesity; the highest-risk category, often a threshold considered for bariatric surgery |
This six-tier ladder is the global standard used by the WHO and referenced by bodies like the CDC. It works reasonably well at a population level in the countries it was originally built around. It works far less well for India — and the reason is not a rounding error, it’s a documented biological difference in how South Asian bodies store fat.
India’s BMI Cutoffs Are Lower — And That Changes Everything
In 2004, a WHO Expert Consultation published in The Lancet made a formal recommendation that is still under-known even among patients who’ve been given a BMI reading by their doctor: for Asian populations, the action points for overweight and obesity should be set lower than the global standard — overweight from a BMI of 23 (instead of 25), and obesity from a BMI of 27.5 (instead of 30).
India went a step further. A 2009 consensus statement from a panel of Indian physicians, published in the Journal of the Association of Physicians of India and still widely cited in Indian clinical practice, set the Indian-specific cutoffs even tighter: overweight at BMI 23.0–24.9, and obesity beginning at just 25 — five full points below the global obesity threshold of 30.
The reasoning behind both revisions is the same: Indians and other South Asians tend to carry a higher proportion of body fat, and specifically more visceral (organ-surrounding) fat, at any given BMI than white European populations do. A BMI that would be read as “healthy” in London or Toronto can already carry meaningfully elevated diabetes and cardiovascular risk in Mumbai or Chennai.
You can see the real-world effect of this cutoff choice in India’s own national data. Using the standard global BMI threshold, the National Family Health Survey-5 (2019–21) recorded overweight-and-obesity prevalence of 24.0% among women and 22.9% among men — already a sharp rise from 12.6% and 9.3% respectively in the earlier NFHS-3 round. But when researchers reanalysed that same NFHS-5 dataset using the Asian-specific BMI cutoff of 23, published in the journal Journal of Obesity, the prevalence roughly doubled — to 44.02% among men and 41.16% among women. Same people, same survey, a different — and arguably more clinically honest — line drawn on the chart.
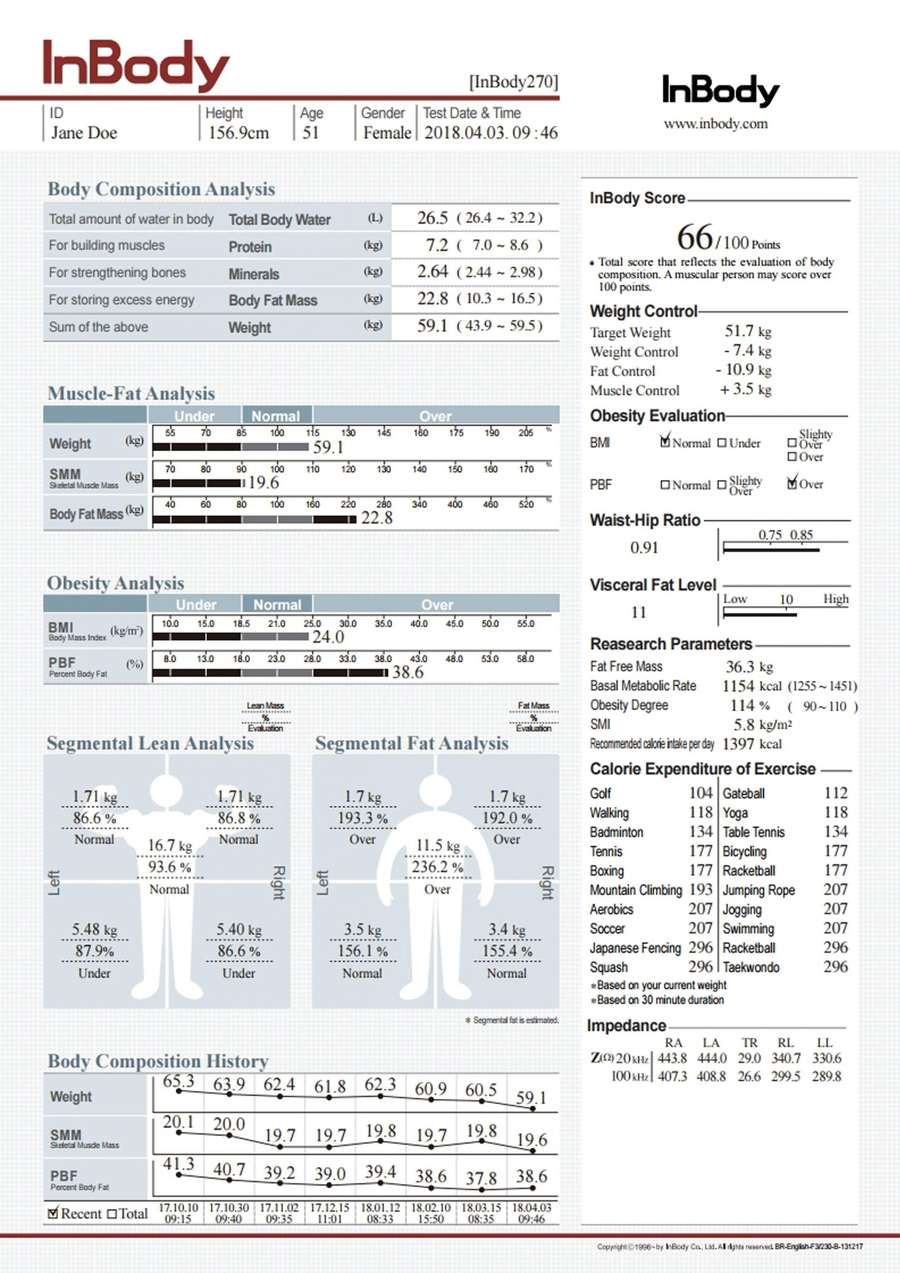
The Stage Your BMI Can’t See
Here is where BMI-based staging, even the corrected Indian version, starts to fall apart for individuals rather than populations: it still can’t tell you where your fat actually is, or how much muscle you’re carrying underneath it.
This gap has a name in the clinical literature — normal-weight obesity, or its more colloquial cousin, “skinny fat” (also called TOFI: thin outside, fat inside). It describes someone whose BMI sits comfortably in the “normal” band but whose body fat percentage, and specifically their visceral fat, is high enough to carry real metabolic risk. It is, if anything, more common in India than most people assume:
- The ICMR-INDIAB national study — one of India’s largest metabolic health surveys, drawing on a sample of over 19,000 adults from a wider cohort of 113,000+ across 31 states and union territories — found that 43.3% of Indian adults with a BMI below 25 (i.e., “normal weight” by global standards) already met clinical criteria for metabolic obesity: at least two of five markers including elevated waist circumference, high fasting glucose, raised blood pressure, high triglycerides, or low HDL cholesterol.
- A separate study from the Kerala Diabetes Prevention Program found normal-weight obesity in 32% of participants — people whose scale weight looked fine but whose body composition told a different story.
- An NFHS-5 analysis of abdominal obesity, measured by waist circumference rather than BMI, found central obesity in an estimated 40% of Indian women and 12% of Indian men — a pattern of fat distribution that a BMI reading alone simply cannot detect.
This is precisely the blind spot we’ve written about before: BMI can put two people with wildly different actual health risk into the same category, and it’s why the phenomenon of “hidden obesity” in normal-weight Indians deserves as much attention as the traditional BMI staging ladder. A BMI-only reading of “Stage: Normal” can quietly sit on top of a Visceral Fat Area already past the 100 cm² clinical risk threshold — the point at which InBody testing flags meaningfully elevated risk for insulin resistance, fatty liver, and cardiovascular strain, regardless of what the scale or the BMI chart says.
The reverse is also true, and worth saying plainly: a muscular person with a BMI of 27 — technically “overweight,” even by the Indian cutoff — may have a low body fat percentage, strong skeletal muscle mass, and genuinely low metabolic risk. BMI staging moves in one direction only (weight over height squared); real risk depends on what that weight is actually made of.
What To Actually Do At Each Stage
BMI staging is a reasonable first flag, not a diagnosis. Here’s how to act on it responsibly, whichever stage you land in:
- Treat “normal weight” as a starting point, not a clearance. If your BMI is under 25 but you have a family history of diabetes or heart disease, visible abdominal fat, or you simply feel off, don’t assume the chart has the final word — get a body composition test.
- If you’re in the overweight band (BMI 23–24.9 by Indian cutoffs), measure your waist. A waist circumference above roughly 90 cm in men or 80 cm in women, alongside an overweight BMI, is a stronger combined signal of visceral fat risk than either number alone.
- If you’re in Class 1 or Class 2 (BMI 25 and above by Indian cutoffs), get a full body composition breakdown before starting any weight-loss plan. Knowing your starting Skeletal Muscle Mass matters — a crash diet that strips muscle along with fat can leave you lighter on the scale but worse off metabolically.
- If you’re in Class 3, work with a physician on a structured, medically supervised plan — this is the category where lifestyle change alone is often insufficient, and where clinical evaluation for interventions including pharmacotherapy or bariatric surgery becomes a reasonable conversation.
- At every stage, track Visceral Fat Area and Skeletal Muscle Mass, not just weight or BMI. These are the numbers that actually move in response to diet and exercise, and they move independently of what the scale shows — you can lose visceral fat and gain muscle while your weight barely changes.
- Re-test every 8–12 weeks during active intervention. Body composition changes measurably over that window; BMI often doesn’t move enough over the same period to tell you whether what you’re doing is actually working.
Frequently Asked Questions
What are the 4 stages of obesity according to WHO?
The WHO’s global BMI system defines three stages of obesity beyond “overweight”: Class 1 (BMI 30.0–34.9), Class 2 (BMI 35.0–39.9), and Class 3 (BMI 40.0 and above, sometimes called severe or morbid obesity). Overweight itself (BMI 25.0–29.9) is often described as the stage before obesity begins. Together, overweight through Class 3 form the commonly referenced four-stage progression.
What BMI is considered obese in India?
India’s 2009 clinical consensus guidelines, still widely used by Indian physicians, set obesity at a BMI of 25 or above — well below the global WHO threshold of 30. Overweight in India is defined as a BMI of 23.0–24.9. These lower cutoffs exist because Indians tend to carry more visceral fat, and face higher diabetes and heart disease risk, at any given BMI compared to Western populations.
Can you be obese or metabolically unhealthy with a normal BMI?
Yes — this is called normal-weight obesity, or “skinny fat.” India’s ICMR-INDIAB national study found that 43.3% of Indian adults with a BMI under 25 already met clinical criteria for metabolic obesity, including elevated waist circumference, high blood sugar, or abnormal cholesterol. A normal BMI does not rule out high visceral fat or elevated disease risk.
What is the difference between overweight and Class 1 obesity?
By global WHO cutoffs, overweight is a BMI of 25.0–29.9, while Class 1 obesity begins at 30.0. By India’s own clinical guidelines, the equivalent transition happens much earlier — overweight is 23.0–24.9, and obesity (equivalent to Class 1 territory) begins at just 25. Class 1 generally carries a meaningfully higher risk of diabetes, hypertension, and joint problems than the overweight stage.
What is Class 3 or morbid obesity?
Class 3 obesity is a BMI of 40 or above under the global WHO system — historically referred to as “morbid obesity,” though clinicians now more often use “severe obesity.” It is associated with the highest risk of Type 2 diabetes, cardiovascular disease, and joint degeneration, and is the stage at which structured medical intervention, including possible bariatric surgery, is most commonly discussed.
Should obesity in India be diagnosed by BMI or body fat percentage?
Ideally, both. BMI is free, fast, and useful as a first screen, which is why it remains standard in Indian healthcare. But because BMI cannot distinguish fat from muscle or show where fat is stored, Indian researchers and increasingly clinicians recommend pairing it with body composition testing — measuring body fat percentage, visceral fat area, and skeletal muscle mass — for an accurate individual risk picture, especially near the “normal-to-overweight” boundary.
What visceral fat level is considered dangerous?
On an InBody body composition report, a Visceral Fat Area (VFA) above 100 cm² is generally treated as the clinical risk threshold, associated with meaningfully higher risk of insulin resistance, fatty liver, and cardiovascular strain. Because visceral fat sits around internal organs rather than under the skin, it cannot be estimated from BMI or even from how a person looks — it requires a direct measurement.
Wherever you land on the BMI ladder — underweight, normal, overweight, or one of the three obesity classes — the number alone can’t tell you how much of your weight is muscle, how much is fat, or where that fat is sitting. Get an InBody body composition test to see your actual Skeletal Muscle Mass, Percent Body Fat, and Visceral Fat Area, not just a single ratio of weight to height. Find out what an InBody test involves and book yours here.
If your BMI has you confused rather than reassured, two related reads worth your time: why BMI gets Indian bodies wrong so often, and how to read every number on your InBody report once you’ve been tested.

Most trending articles
वज़न बढ़ाने के लिए क्या खाएं? सही डाइट प्लान (सिर्फ ज़्यादा खाना नहीं)
सिर्फ ज़्यादा खाने से मांसपेशी नहीं बनती, चर्बी बढ़ सकती है। सही कैलोरी सरप्लस, प्रोटीन और डाइट प्लान जो वज़न को सही तरीके से बढ़ाए — पूरी जानकारी हिंदी में।
भारत में प्रोटीन कितना ज़रूरी है? असली आंकड़े और सही फॉर्मूला
IMRB के एक सर्वे में लगभग 73% भारतीय आहार प्रोटीन-कम पाए गए। सही प्रोटीन टारगेट कैसे निकालें और किन फूड्स से पूरा करें — पूरी जानकारी हिंदी में।
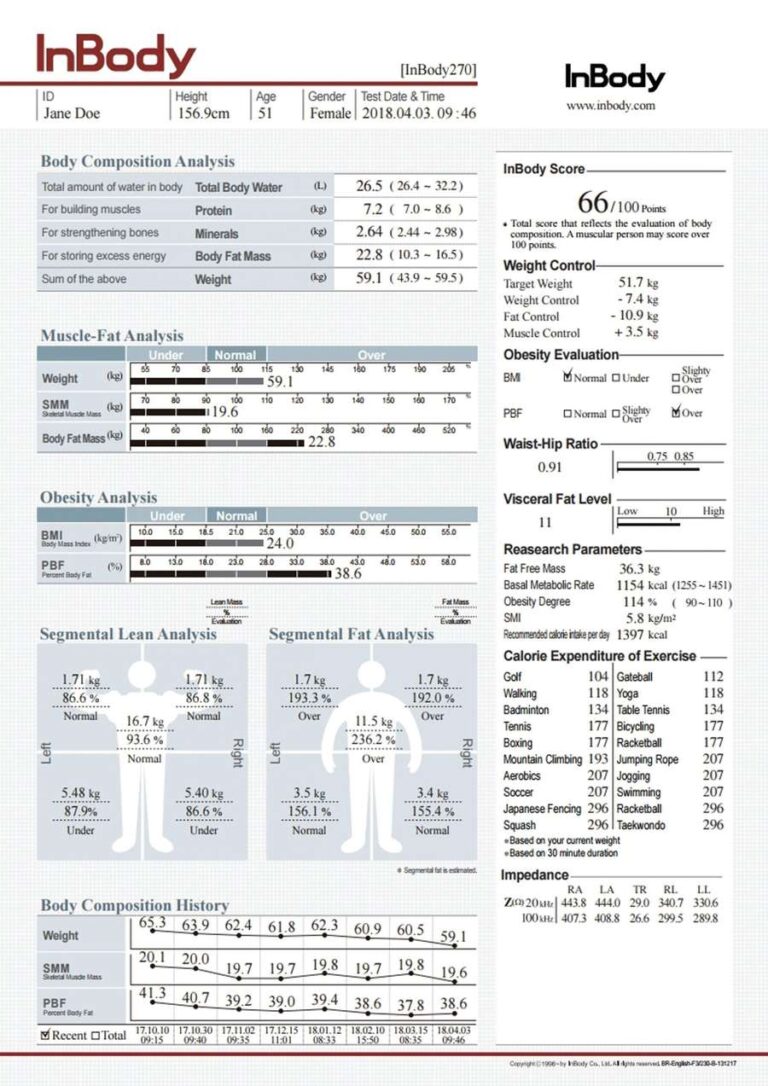
Metabolic Age क्या होती है? आपकी उम्र से ज़्यादा है या कम?
आपकी असली उम्र 34 है पर शरीर 50 साल जैसा व्यवहार कर सकता है। Metabolic age क्या है, मांसपेशी घटने के जोखिम क्या हैं और इसे कैसे घटाएं — पूरी जानकारी।