
Health 11 min read
India’s Air Pollution Problem: How Toxic City Air Could Be Sabotaging Your Visceral Fat Numbers — Even If Your Diet Is Perfect
Delhi-NCR loses 8.2 years of life to toxic air. Emerging research links PM2.5 to visceral fat and insulin resistance — the body composition angle explained.
Reading about body composition? Find an InBody test centre near you →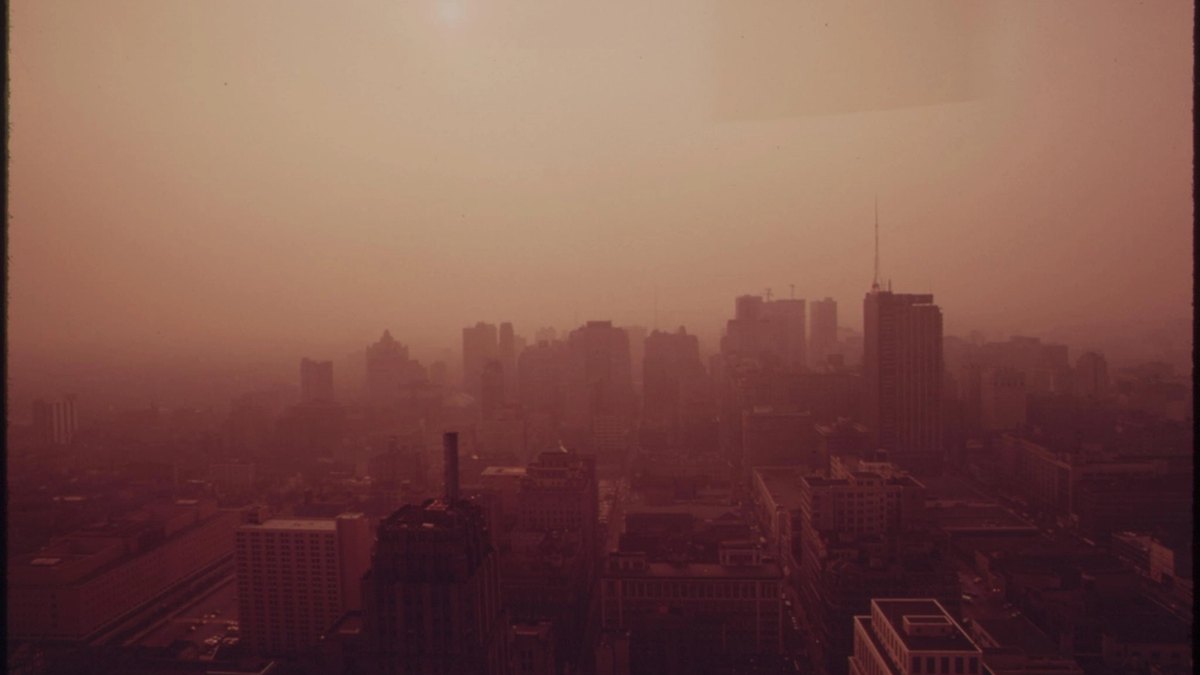
India’s Air Pollution Problem: How Toxic City Air Could Be Sabotaging Your Visceral Fat Numbers — Even If Your Diet Is Perfect
You’ve cut the sugar. You train four times a week. Your diet is dialled in, your sleep is decent, and yet your latest InBody scan shows Visceral Fat Area creeping up instead of down. If you live in Delhi-NCR, Gurugram, Noida, Lucknow, Patna, or any of the dozens of Indian cities battling some of the worst air pollution on the planet, a genuine and growing body of medical research points at a variable that has nothing to do with your plate or your gym log — the air you breathe. PM2.5, the fine particulate matter that blankets Indian cities every winter, is now an active area of research into visceral fat, insulin resistance, and metabolic health, and for urban India the implications are hard to ignore.
To be clear: nothing in the current science suggests pollution replaces diet and training as the primary driver of body fat, and nothing here is medical advice. What the emerging research does suggest is that where PM2.5 routinely runs many multiples of the WHO’s safe limit, the environment itself may be quietly working against the metabolic effort people put in — and that visceral fat, not body weight, is the number most likely to reveal it.

How Inhaled Pollution Reaches Your Metabolism
PM2.5 refers to particles 2.5 micrometres or smaller — roughly 1/30th the width of a human hair, small enough to bypass the nose and throat’s natural filtering, travel deep into the lungs, and in significant quantities, cross into the bloodstream itself. Once there, the body mounts the inflammatory response it would to any foreign irritant. For hundreds of millions of Indians, this isn’t a one-off exposure — it’s a daily, year-round, low-grade assault that never fully resolves.
Researchers have been mapping the metabolic consequences for over a decade. In one of the most cited studies in the field, published in Circulation, mice exposed to concentrated ambient PM2.5 for several months developed marked whole-body insulin resistance alongside a measurable increase in visceral fat, with visceral fat tissue showing higher levels of the inflammatory markers TNF-alpha and IL-6 — the same signalling molecules implicated in fatty liver and dyslipidemia elsewhere on this blog. This was an animal study, and translating animal biology to humans always requires caution — but it gave researchers a specific, testable mechanism to look for in people.
That human evidence has been accumulating. A 2024 Mendelian randomisation study — a genetic-epidemiology method that uses inherited variants to test whether an exposure is more likely to be causal rather than merely correlated — found genetically predicted higher PM2.5 exposure positively associated with visceral adipose tissue, with an odds ratio of 1.86. A cohort of nearly 50,000 adults in southern China’s Yunnan province linked specific PM2.5 chemical constituents directly to a validated visceral adiposity index. Most relevant to India: a cohort study tracked 12,064 adults in Chennai and Delhi from 2010 to 2017 and found every 10 µg/m³ rise in annual average PM2.5 was associated with a 22% higher incidence of type 2 diabetes, with fasting glucose and HbA1c tracking pollution exposure even before diagnosis.
The proposed mechanism runs through systemic inflammation and oxidative stress: PM2.5 exposure appears to interfere with insulin’s ability to move glucose into muscle cells efficiently, so the body shunts more glucose toward fat storage — preferentially toward visceral fat, the depot most tied to inflammatory activity. Researchers call this a biologically plausible, increasingly well-evidenced pathway, but are careful to flag it as emerging and still-developing in humans — one contributing factor among many, not a replacement for the diet, exercise, sleep, and stress factors this blog has covered before.
Just How Bad Is India’s City Air?
The scale of the problem is difficult to overstate. According to the 2025 Air Quality Life Index (AQLI) report from the University of Chicago’s Energy Policy Institute, every single one of India’s 1.4 billion residents lives in an area exceeding the WHO’s safe annual PM2.5 guideline of 5 µg/m³. Air pollution cuts the average Indian’s life expectancy by an estimated 3.5 years — a bigger toll than childhood and maternal malnutrition, and more than five times the toll of unsafe water and sanitation combined. Delhi-NCR fares worst of all: residents there lose an estimated 8.2 years of life expectancy to toxic air, the single largest loss recorded for any major city in the world. Bihar (5.6 years), Haryana (5.3 years), and Uttar Pradesh (5 years) aren’t far behind.
The raw numbers explain why. Delhi’s annual average PM2.5 in 2025 was 99.6 µg/m³, making it the world’s 4th most polluted city — nearly 20 times the WHO guideline. Nationally, India’s average of 48.9 µg/m³ is roughly 9.8 times the WHO limit, placing the country 6th worst globally. Winter, when a temperature inversion traps pollution over the Indo-Gangetic Plain, makes things dramatically worse: Central Pollution Control Board monitoring data for winter 2025-26 shows 204 of 238 Indian cities with sufficient data exceeded even India’s own, considerably weaker national standard, up from 173 the year before, and all 28 monitored cities in the National Capital Region failed to comply. Ghaziabad, Noida, and Delhi were the three worst performers nationally, with winter averages of 172, 166, and 163 µg/m³ respectively, and Loni, a town in Ghaziabad, posted the highest annual average PM2.5 measured anywhere in the country.
| Location | Annual average PM2.5 (µg/m³) | vs. WHO safe guideline (5 µg/m³) |
|---|---|---|
| WHO safe annual guideline | 5 | Reference point |
| India, national average (2025) | 48.9 | ~9.8x higher |
| Delhi (2025) | 99.6 | ~20x higher |
| Loni, Ghaziabad (India’s most polluted location) | 112.5 | >22x higher |
Much of Delhi’s own pollution burden is home-grown: source-apportionment analysis attributes roughly 51.5% of the city’s local PM2.5 to vehicular emissions, with another 35% arriving from surrounding NCR districts through regional transport of dust, construction, and industrial emissions. This matters at population scale, not just individual scale — when hundreds of millions of people share the same inflammatory exposure year after year, even a modest per-person metabolic effect adds up to a measurable public health burden. And it isn’t a Delhi-only story: Ghaziabad, Noida, Lucknow, Patna, Kanpur, and dozens of other Indo-Gangetic Plain cities post similar or worse numbers through the winter months.

Why Visceral Fat Is the Number to Watch — Not the Scale
If pollution is contributing to metabolic dysfunction, the fat depot most likely to show it first is visceral fat, not total body weight or BMI. Visceral fat — packed around the liver, intestines, and pancreas — is metabolically active in a way subcutaneous fat is not. It responds to inflammatory signalling, drains directly into the portal vein feeding the liver, and expands preferentially under chronic low-grade inflammatory stress — precisely the state PM2.5 exposure appears to promote. We’ve covered this same portal-vein mechanism in the context of fatty liver and high cholesterol in India; air pollution looks like another input feeding the same inflammatory pathway, not a separate story.
This is why a standard health check can miss what’s happening. Body weight can stay flat, BMI can look “normal,” and blood sugar can sit in a borderline range for years before diagnosis. What a bathroom scale cannot do — and body composition analysis can — is isolate the Visceral Fat Area (VFA) number and the ECW/TBW ratio, InBody’s marker for the systemic fluid shift associated with inflammation. A VFA trending upward alongside a persistently elevated ECW/TBW ratio, despite consistent diet and training, is a pattern worth paying attention to.
This is where testing becomes genuinely useful rather than anxiety-inducing. If your diet and training haven’t meaningfully changed but your visceral fat number has, body composition tracking is one of the only practical ways to separate “the environment may be working against me” from “my diet and training aren’t working.” Testing before the winter smog season sets in (September-October) and again after it peaks (February-March) gives you a real before-and-after read against the same lifestyle inputs — one a single annual check-up can’t provide.
A Practical Harm-Reduction Protocol for Polluted Indian Cities
None of this is medical advice, and none of it argues for panic or for moving out of India’s cities. It’s a case for treating outdoor air quality as a measurable, trackable input — the same way this blog treats sugar, sleep, alcohol, and stress — rather than a background condition nobody can do anything about.
- Check your actual AQI, not just the season’s reputation. Apps built on government data (SAFAR-Air, the CPCB’s own AQI app) and trackers like IQAir give real-time, locality-level readings. India’s official scale runs Good (0-50), Satisfactory (51-100), Moderate (101-200), Poor (201-300), Very Poor (301-400), and Severe (400+) — knowing your band each morning takes 30 seconds and should shape your day.
- Match outdoor exertion to the number. Light-to-moderate activity is generally fine on Good and Satisfactory days. As the index climbs into Moderate and beyond, shorten and lighten prolonged, high-intensity sessions; once conditions cross into Poor, Very Poor, or Severe — common across north Indian winters — shift training indoors.
- Invest in indoor air quality where you sleep. HEPA air purifiers meaningfully cut indoor PM2.5 — one trial showed a drop from roughly 33.5 µg/m³ to 17.2 µg/m³ — with improved subclinical cardiopulmonary markers after days to weeks of use. A purifier in the bedroom, where you spend a third of your day, is a higher-yield investment than one in a room you pass through.
- Protect your commute. A well-fitted N95 or N99 mask during unavoidable outdoor exposure — waiting for transport, riding a two-wheeler, walking high-traffic roads on Poor-to-Severe days — reduces particulate intake, even if it can’t eliminate it.
- Build antioxidant support into your diet. Early clinical research on dietary antioxidants — vitamin C, vitamin E, and omega-3s — suggests they may help blunt some of the oxidative stress pollution triggers. Citrus fruits, amla, guava, nuts, seeds, and fatty fish (or algal omega-3 for vegetarians) are reasonable, low-risk additions — complementary support, not a substitute for reducing exposure.
- Track, don’t guess. If your VFA or ECW/TBW ratio is rising despite consistent effort, don’t assume your programme has failed. Retest every 8-12 weeks and compare pre-winter and post-winter numbers over a year or two — a pattern that consistently worsens through pollution season and improves through the monsoon is information only body composition tracking can surface.
Frequently Asked Questions
Can air pollution really cause visceral fat gain?
The evidence is real but still emerging. Animal studies show PM2.5 exposure directly increases visceral fat and insulin resistance, and human genetic studies (Mendelian randomisation) and large cohort studies have found consistent associations between PM2.5 exposure and higher visceral adiposity. Researchers describe this as a biologically plausible, increasingly well-supported link — not yet a fully proven, one-to-one causal story in humans, and not a replacement for diet and exercise as the primary drivers of body fat.
How does PM2.5 affect insulin resistance?
Fine particulate matter appears to trigger systemic inflammation and oxidative stress after entering the bloodstream through the lungs. This inflammatory state interferes with insulin’s ability to move glucose into muscle cells efficiently, pushing more glucose toward fat storage instead. A large Indian cohort study of 12,064 adults in Chennai and Delhi found each 10 µg/m³ rise in annual PM2.5 was associated with a 22% higher incidence of type 2 diabetes.
Which Indian cities have the worst air quality for metabolic health right now?
Ghaziabad, Noida, and Delhi were the three most polluted Indian cities during winter 2025-26, with average PM2.5 levels of 172, 166, and 163 µg/m³ respectively — dozens of times the WHO’s safe annual guideline of 5 µg/m³. Loni in Ghaziabad recorded India’s highest annual average, at 112.5 µg/m³. Most of the Indo-Gangetic Plain, including cities like Lucknow, Patna, and Kanpur, shows a similar seasonal pattern.
Does an air purifier actually help reduce visceral fat risk?
No study has directly tested whether air purifiers change visceral fat measurements. What is established is that HEPA air purifiers meaningfully reduce indoor PM2.5 concentrations and improve subclinical cardiopulmonary health markers within days to weeks of use. Since indoor time — especially sleep — is where most people accumulate the bulk of their daily exposure, reducing indoor PM2.5 is a reasonable, low-risk way to lower your overall pollution burden.
Should I stop outdoor workouts during Delhi’s winter smog season?
Not necessarily stop, but adjust. On Good and Satisfactory AQI days, outdoor activity is generally fine. As the index climbs into Poor, Very Poor, or Severe territory — common through north Indian winters — it makes sense to shift training indoors or to lighter activity, particularly for prolonged, high-intensity sessions where breathing rate and depth increase pollutant intake significantly.
How can I tell if pollution or my diet and training is behind a rising visceral fat number?
You can’t isolate the cause from a single reading, but a pattern over time is informative. If your Visceral Fat Area or ECW/TBW ratio rises specifically through the pollution-heavy winter months and improves during the monsoon and summer despite consistent diet and training, that seasonal swing is a meaningful clue that environmental exposure is a contributing factor worth discussing with a doctor or dietitian.
Know Your Visceral Fat Number — Your Environment Might Be a Factor
Nobody can fully control the air quality of the city they live and work in. What you can control is whether you’re actually measuring what that air might be doing to your body, instead of assuming a stalled visceral fat number means your diet or training has failed. An InBody assessment gives you your Visceral Fat Area, ECW/TBW ratio, and complete muscle-to-fat picture in minutes — data that can help separate an effort problem from an environmental one, especially tracked across pollution seasons rather than once a year.
Book an InBody body composition test and get a real baseline before this winter’s smog season sets in. Related reading: our deep dives on fatty liver and visceral fat in India, why statins alone don’t fix visceral-fat-driven high cholesterol, and the body composition approach to type 2 diabetes reversal.

Most trending articles
Hypothyroidism Symptoms in India: Signs Most People Miss
1 in 10 Indian adults has hypothyroidism, and it hides behind ordinary tiredness. The early signs most people blame on stress, age, or a new baby.

वज़न बढ़ाने के लिए क्या खाएं? सही डाइट प्लान (सिर्फ ज़्यादा खाना नहीं)
सिर्फ ज़्यादा खाने से मांसपेशी नहीं बनती, चर्बी बढ़ सकती है। सही कैलोरी सरप्लस, प्रोटीन और डाइट प्लान जो वज़न को सही तरीके से बढ़ाए — पूरी जानकारी हिंदी में।
भारत में प्रोटीन कितना ज़रूरी है? असली आंकड़े और सही फॉर्मूला
IMRB के एक सर्वे में लगभग 73% भारतीय आहार प्रोटीन-कम पाए गए। सही प्रोटीन टारगेट कैसे निकालें और किन फूड्स से पूरा करें — पूरी जानकारी हिंदी में।